Material description
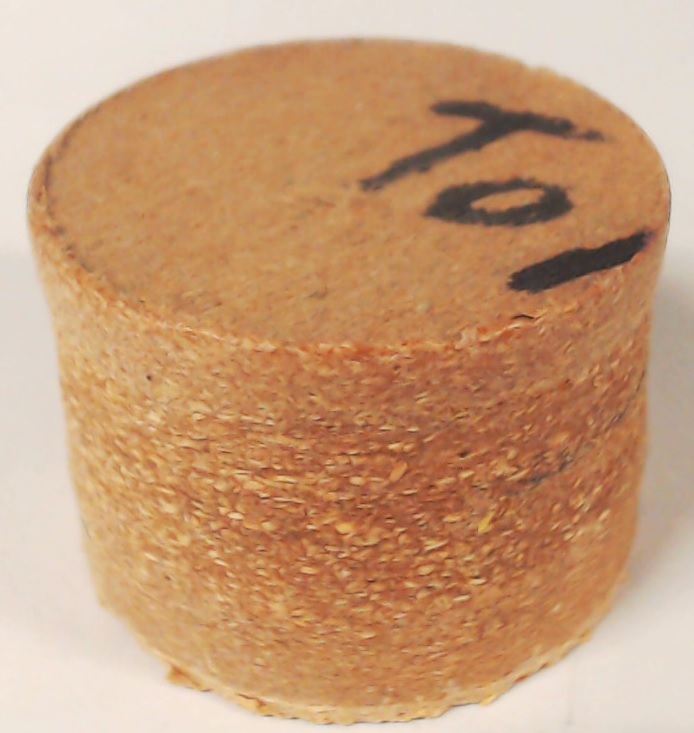
Material ID: OTH24
Material type: Wood polymer composite (WPC).
Polymer: Cellulose and polyethylene (80%)
Additives (fire retardants, fillers or traces of inorganic elements): Talc (12%), Ferric Oxide (6%), Silicon (1%), Calcium (1%), traces of other elements (<1%)
Core thickness: 23.22mm
| Compound | Mass Concentration (%) |
|---|---|
| Cellulose and polyethylene (-) | 80 |
| Talc (Mg3Si4O12H2) | 12 |
| Ferric Oxide (Fe2O3) | 6 |
| Silicon (Si) | 1 |
| Calcium (Ca) | 1 |
| Traces of aluminium (Al) | <1 |
| Traces of sulfur (S) | <1 |
| Traces of chlorine (Cl) | <1 |
| Traces of potassium (K) | <1 |
| Traces of titanium (Ti) | <1 |
A. Material composition identification
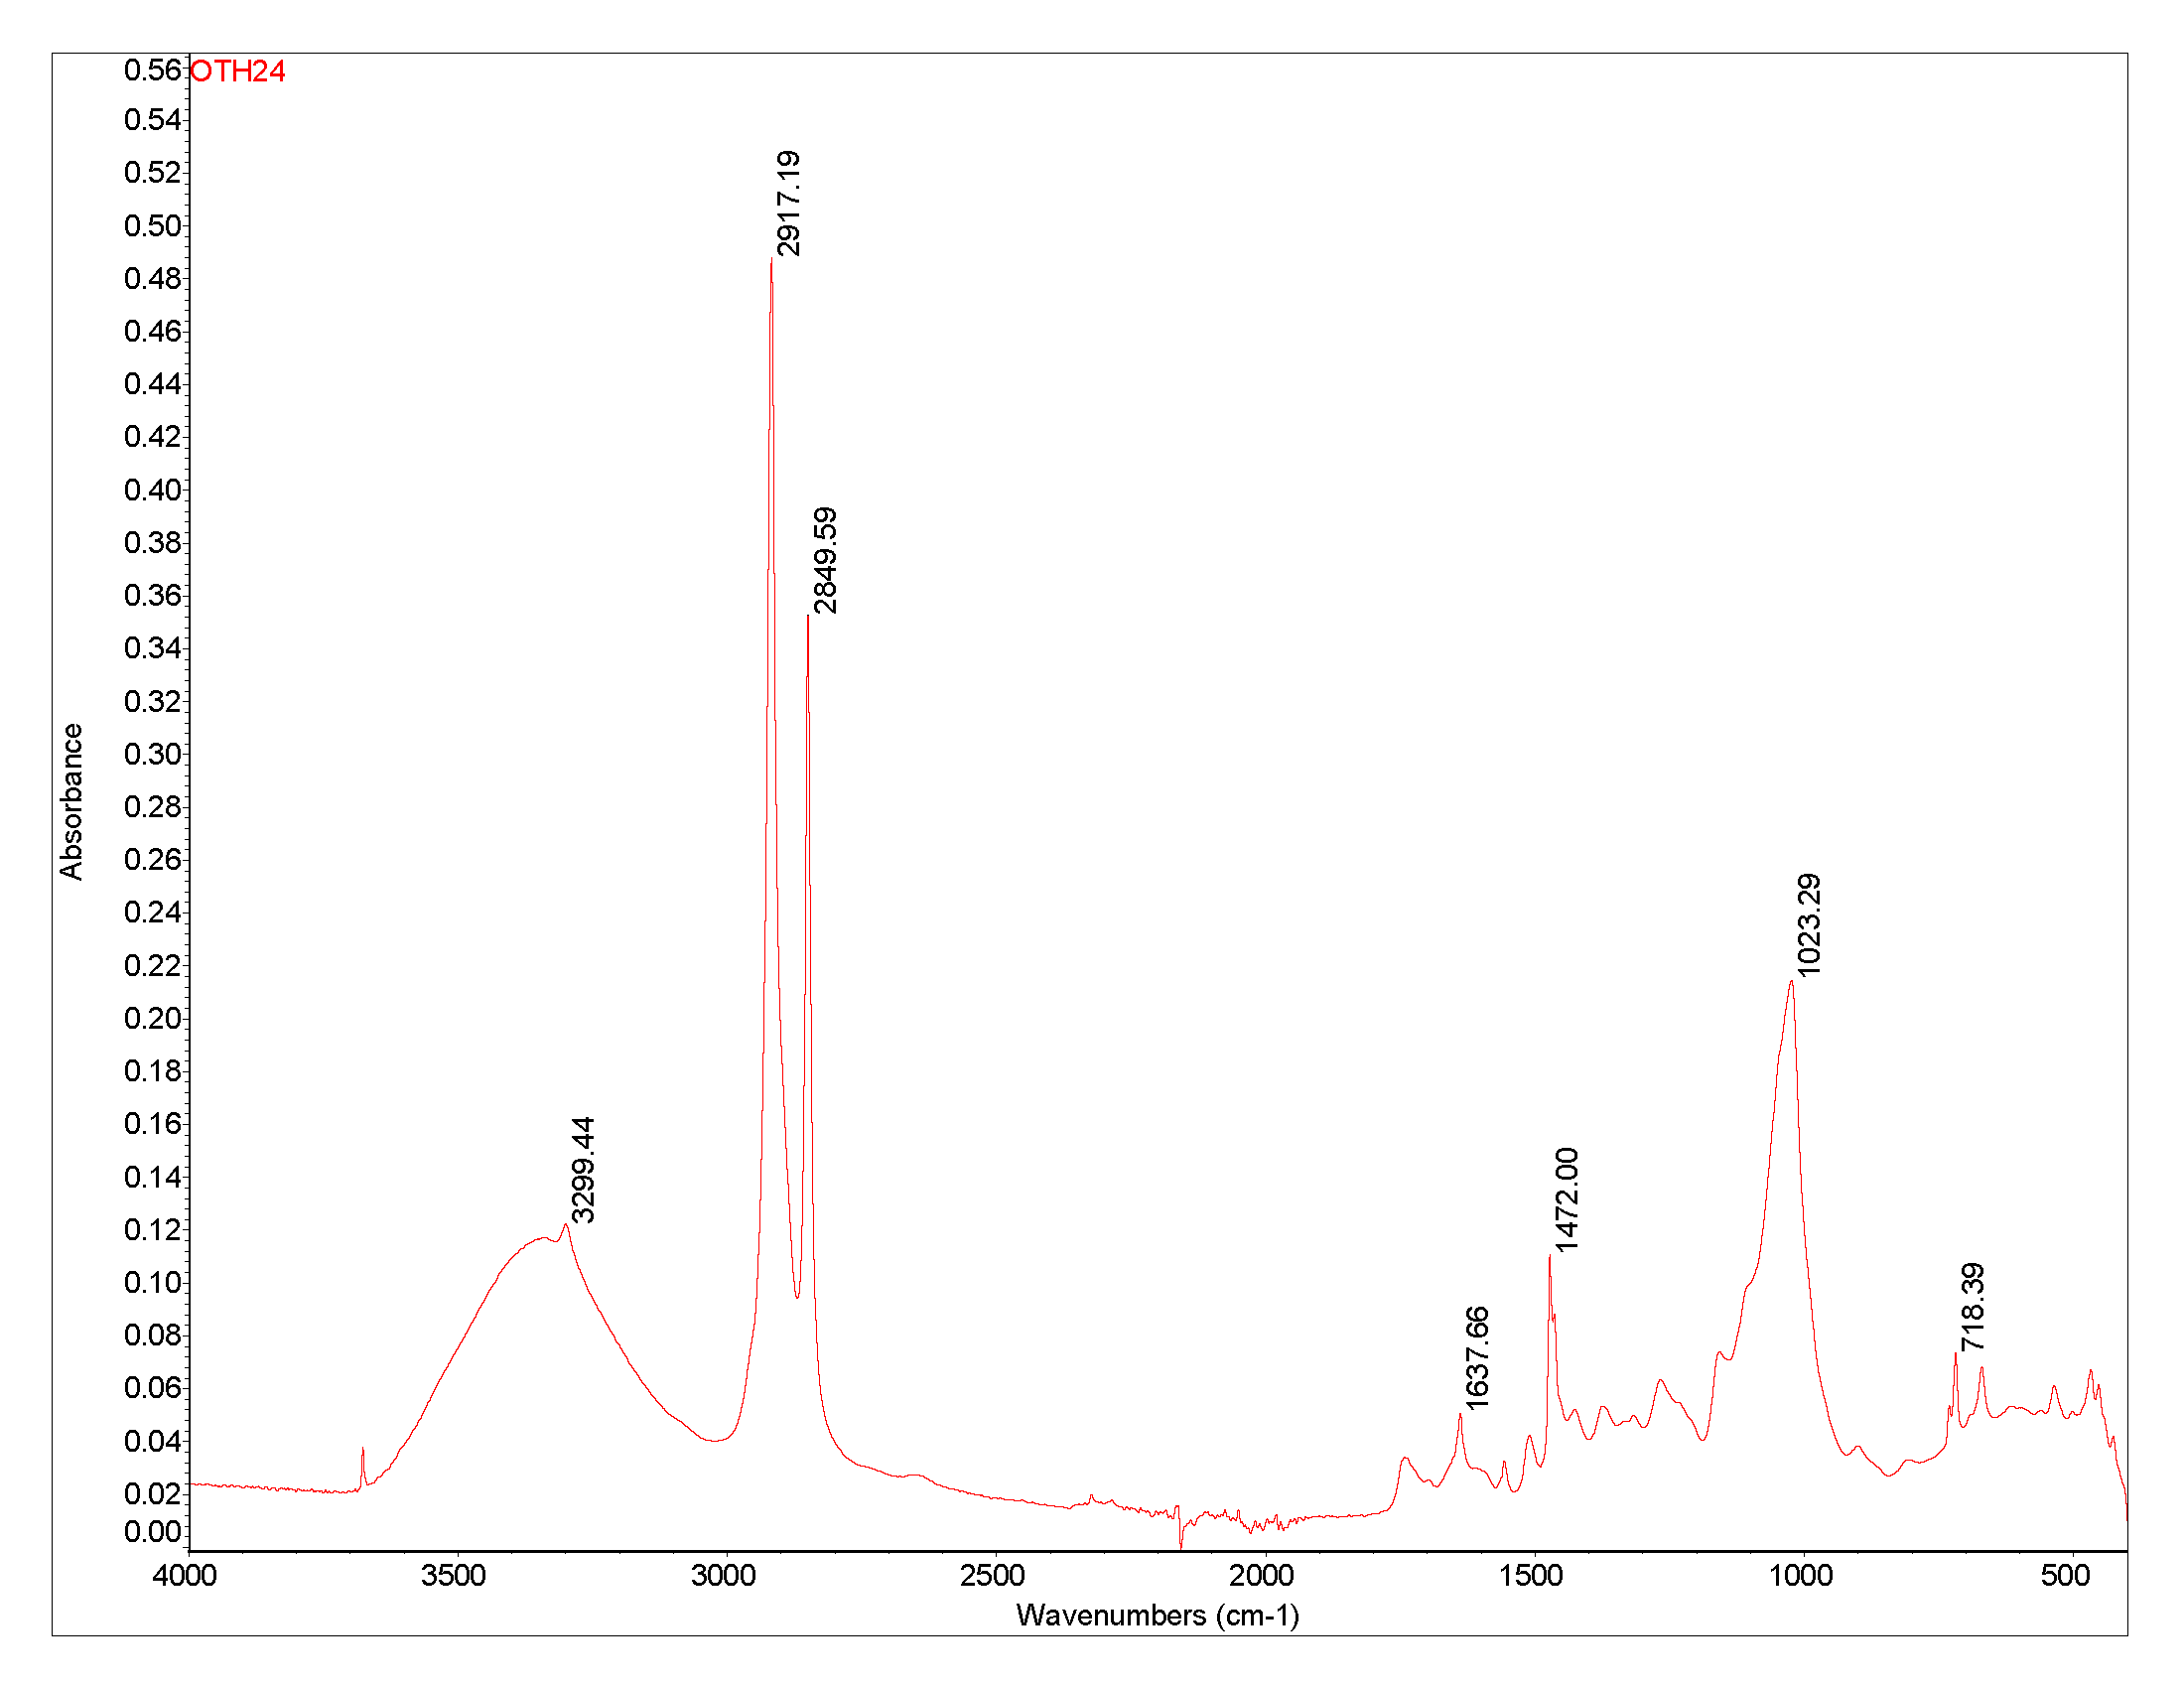
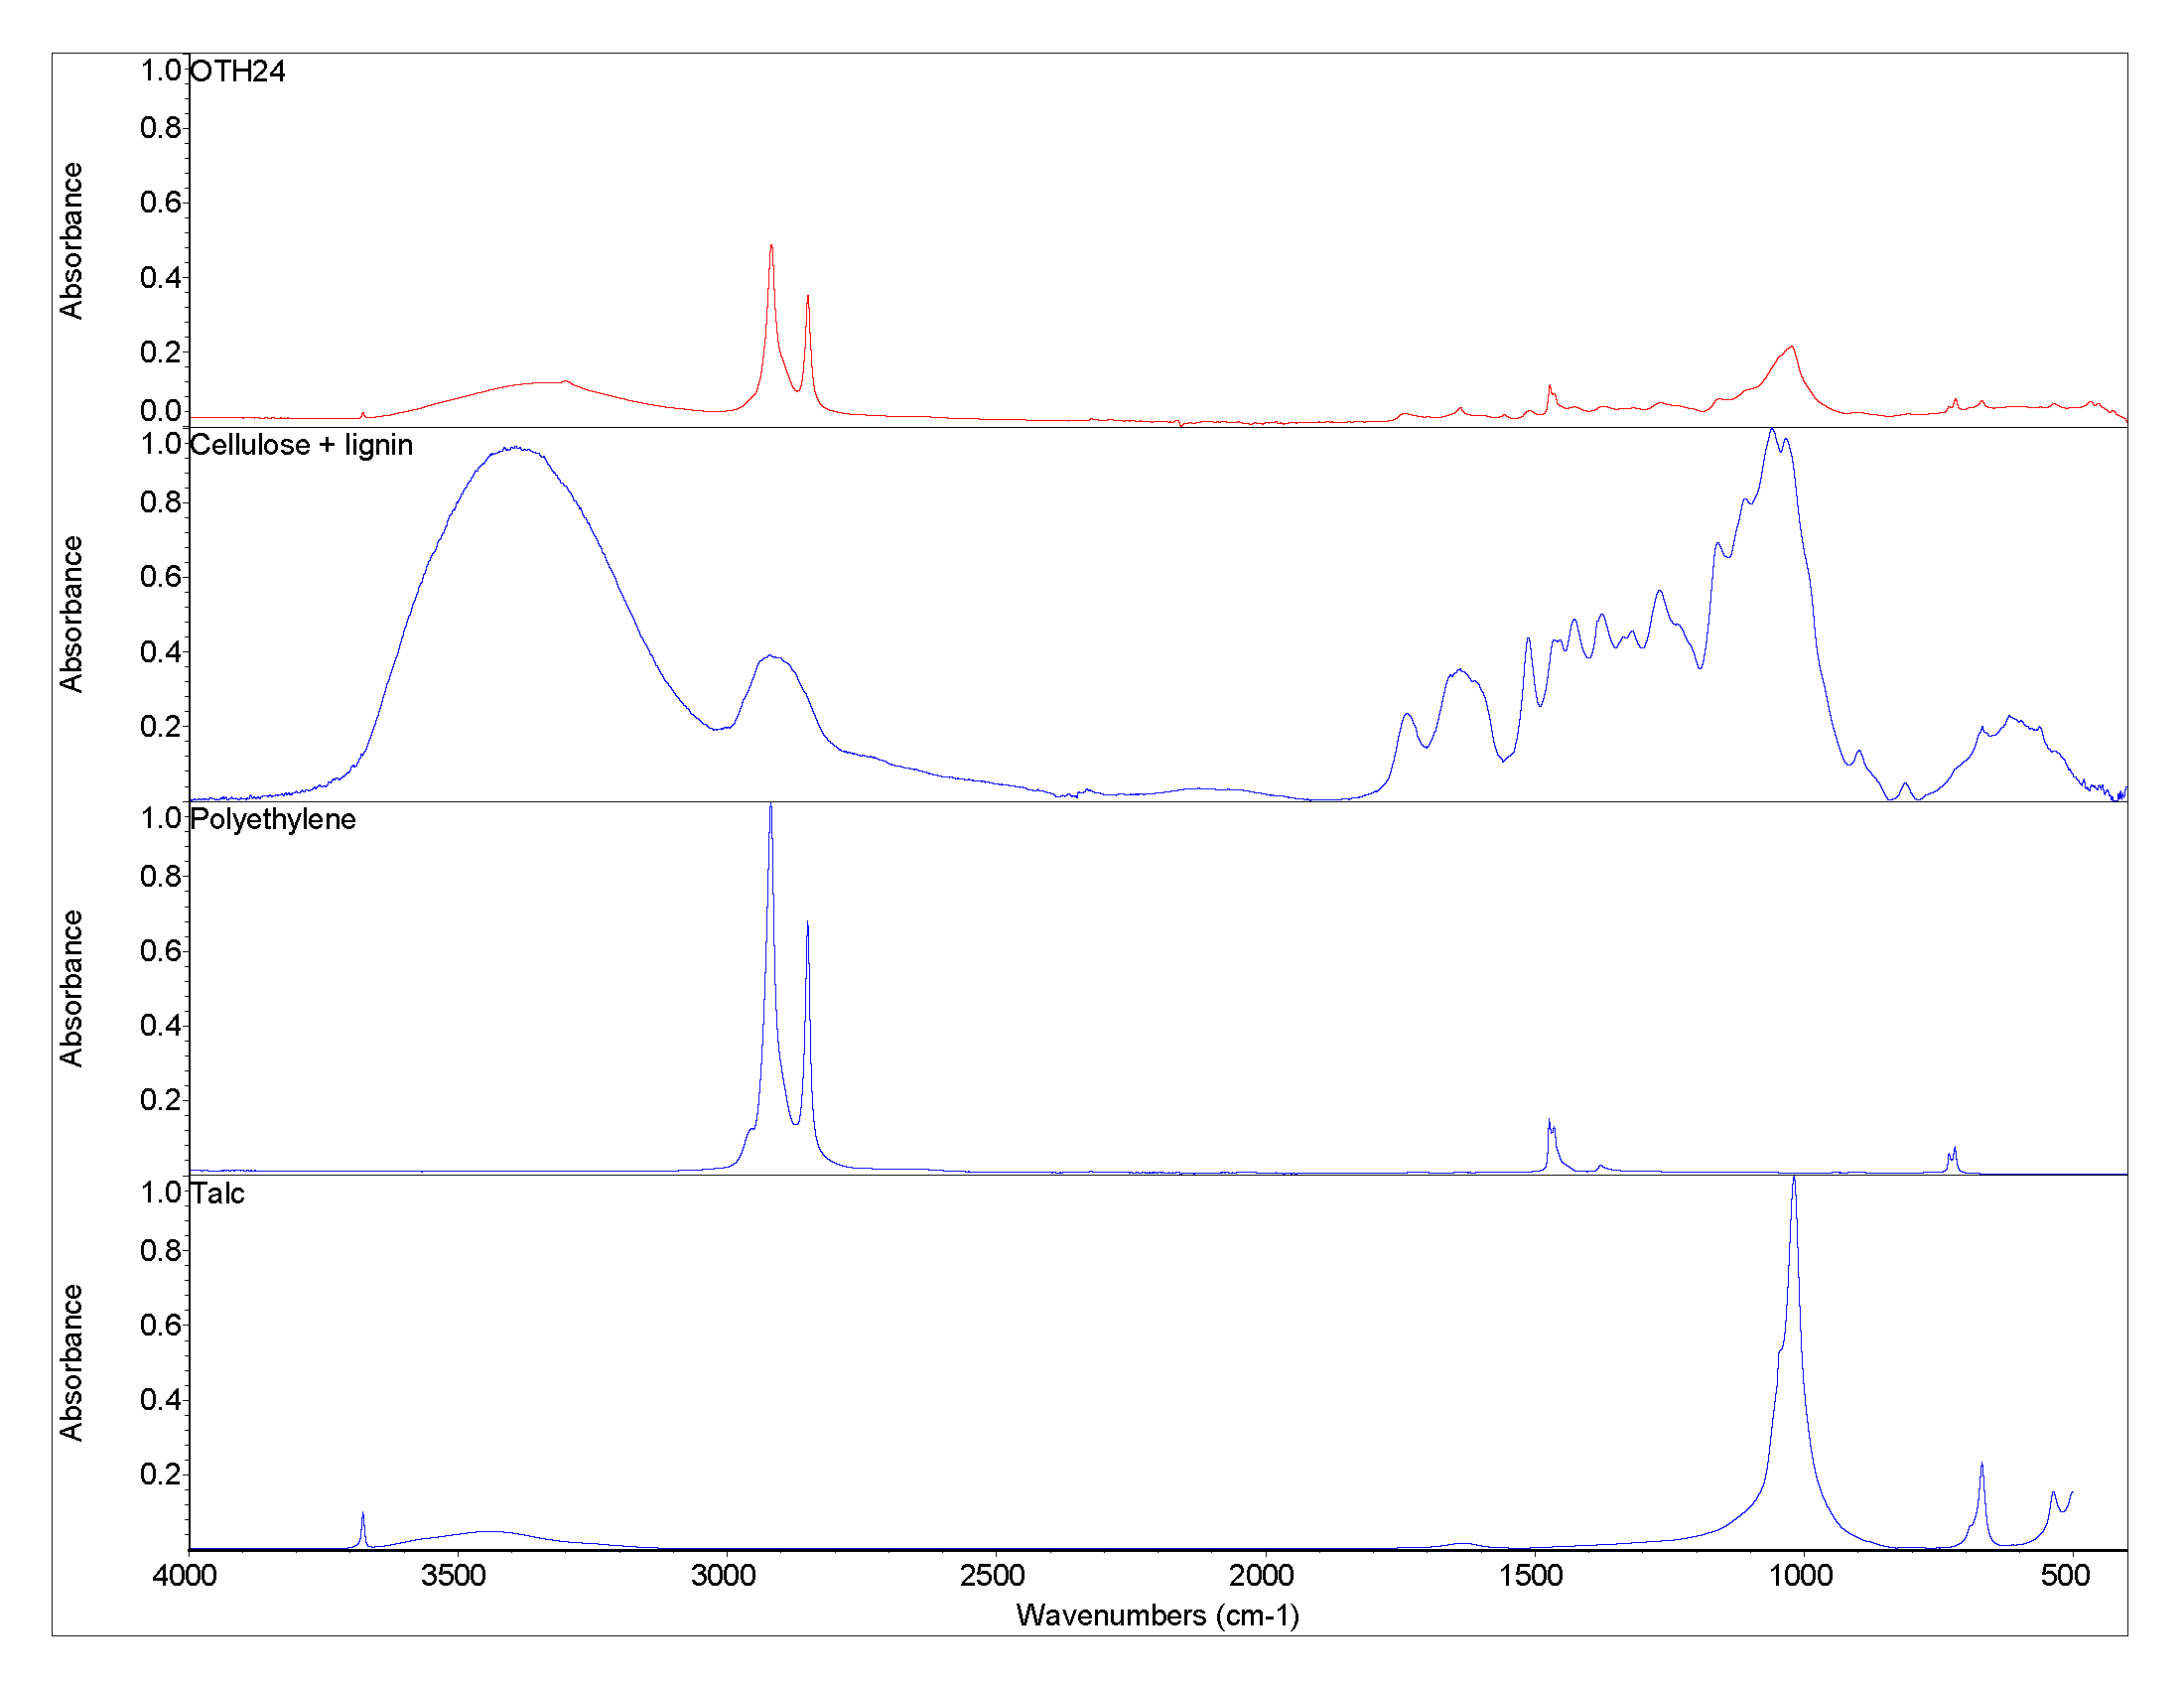
A.1 Attenuated total reflection – Fourier transform infrared spectroscopy (ATR-FTIR)
| Identified Compounds |
|---|
| Cellulose and polyethylene (-) |
| Talc (Mg3Si4O12H2) |
| Ferric Oxide (Fe2O3) |
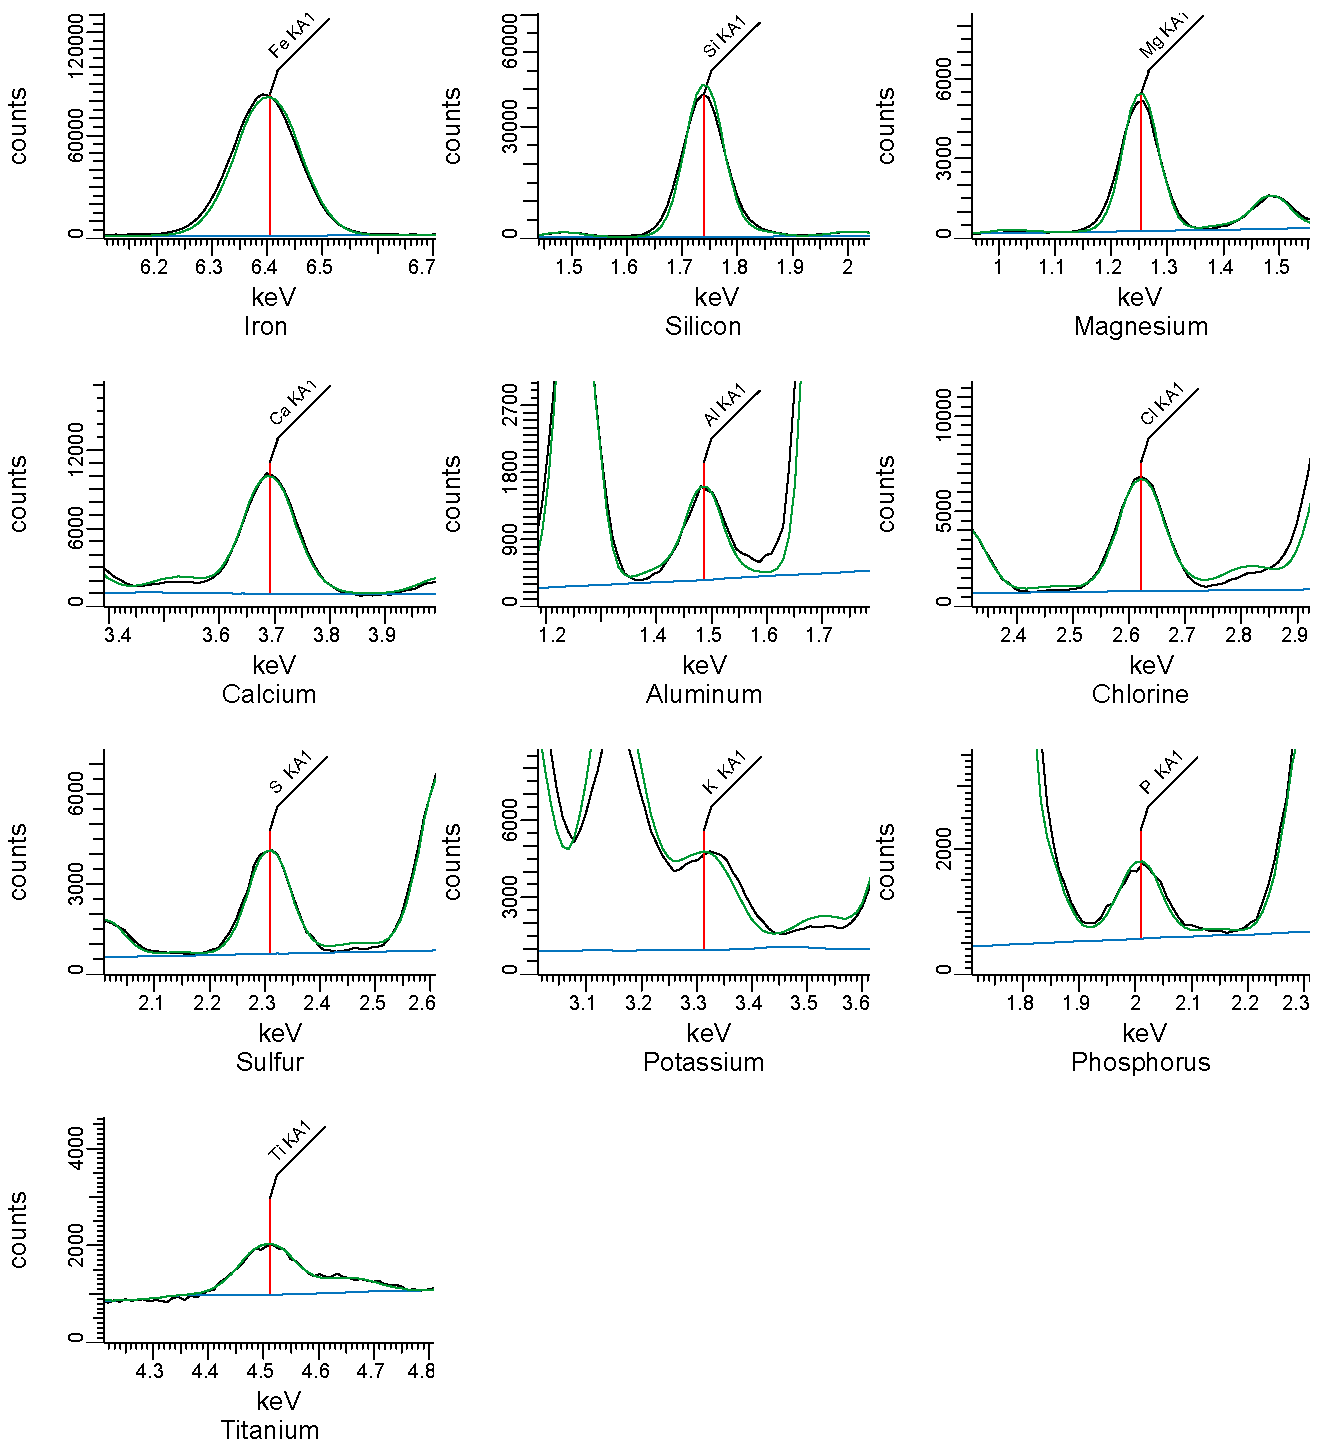
A.2 Energy Dispersive X-Ray Fluorescence (EDXRF)
| Element | Mass Concentration (%) |
|---|---|
| Fe | 6 |
| Si | 5 |
| Mg | 3 |
| Ca | 1 |
| Cl | <1 |
| Al | <1 |
| S | <1 |
| K | <1 |
| Ti | <1 |
| P | <1 |
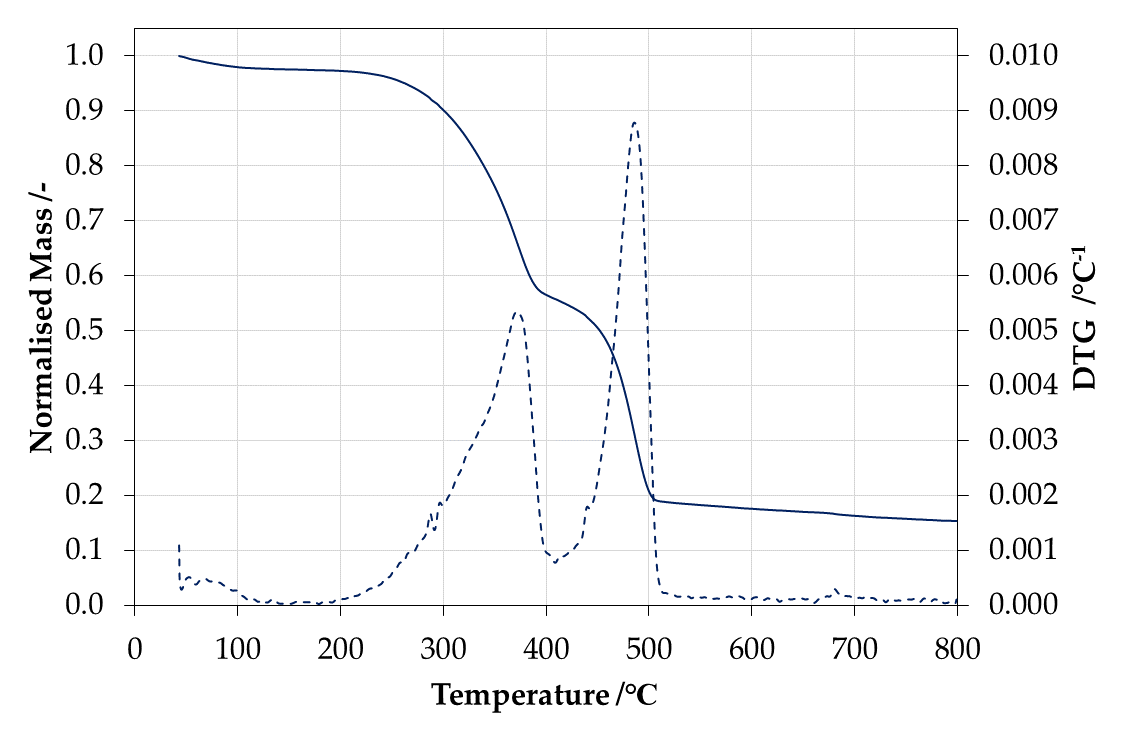
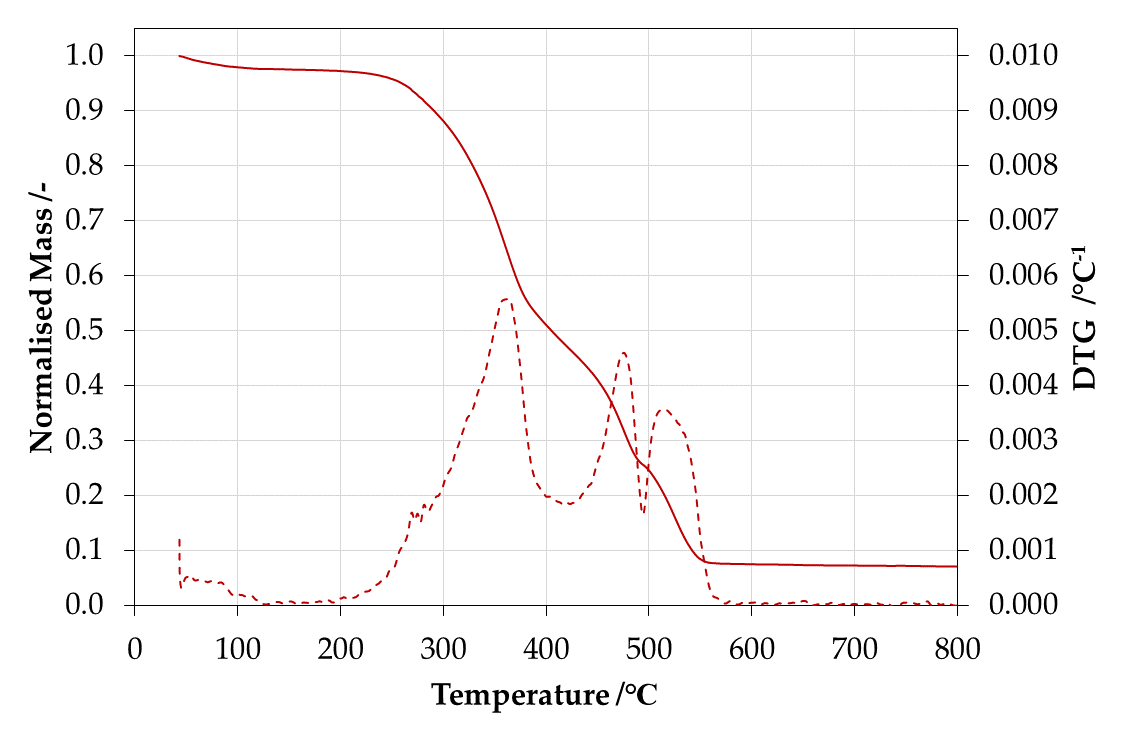
B. Thermogravimetric analysis
| Condition | Fraction of mass residue at 800°C |
|---|---|
| Non-oxidative (nitrogen) | 0.15 |
| Oxidative (air) | 0.07 |
| Peak ID | Temperature peak (°C) | Amplitude of peak (°C-1) |
|---|---|---|
| Peak 1 | 372 | 5.34 x 10⁻³ |
| Peak 2 | 486 | 8.79 x 10⁻³ |
| Peak ID | Temperature peak (°C) | Amplitude of peak (°C-1) |
|---|---|---|
| Peak 1 | 364 | 5.58 x 10⁻³ |
| Peak 2 | 475 | 4.59 x 10⁻³ |
| Peak 3 | 512 | 3.56 x 10⁻³ |
C. Gross Heat of Combustion
| Trial | ΔHc [kJ g-1] |
|---|---|
| Trial 1 | 27.60 |
| Trial 2 | 27.07 |
| Trial 3 | 27.33 |
| Average | 27.33 |
| Std dev | 0.27 |
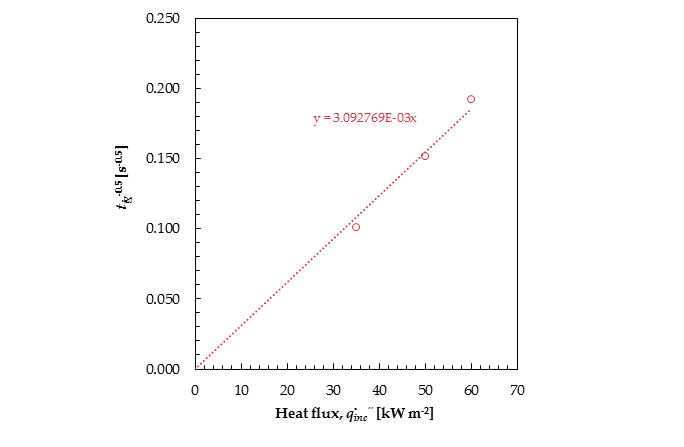
D. Ignition parameters
| Critical heat flux for ignition | Ignition temperature | Total heat transfer coefficient of losses | Apparent thermal inertia |
|---|---|---|---|
| q̇″cr [kW m−2] | Tig [°C] | hr [W m-2 K-1] | kρc [kW2 m-4 K-2 s] |
| 19.50 | 423 | 43.50 | 0.663 |
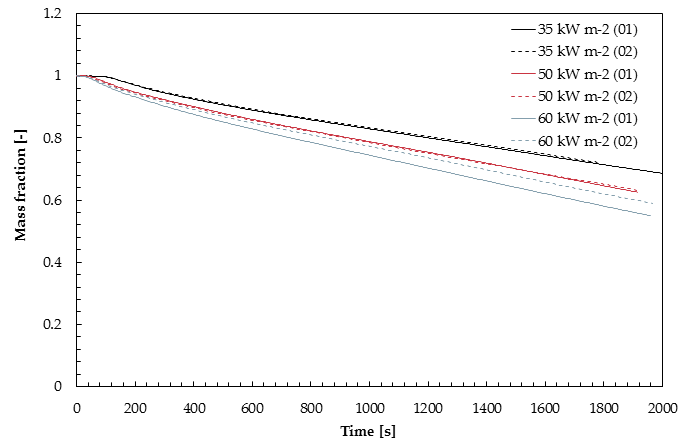
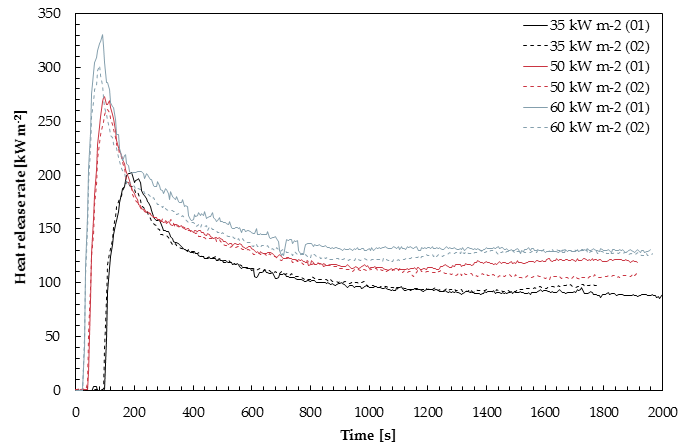
E. Burning behaviour
| Heat flux | Test | Time to ignition | Fraction of mass residue | Peak heat release rate | Total energy released |
|---|---|---|---|---|---|
| q̇″inc [kW m-2] | tig [s] | mres [-] | q̇″p [kW m-2] | Qt [MJ m-2] | 35 kW m-2 |
| Test 1 | 100 | 0.63 | 201.89 | 194.26 | |
| Test 2 | 97 | 0.72 | 193.85 | 186.87 | |
| Avg | 98 | 0.67 | 197.87 | 190.56 | 50 kW m-2 |
| Test 1 | 45 | 0.62 | 273.14 | 240.62 | |
| Test 2 | 42 | 0.63 | 261.03 | 229.53 | |
| Avg | 44 | 0.63 | 267.08 | 235.08 | 60 kW m-2 |
| Test 1 | 27 | 0.55 | 330.29 | 272.94 | |
| Test 2 | 27 | 0.59 | 301.96 | 257.32 | |
| Avg | 27 | 0.57 | 316.13 | 265.13 | 80 kW m-2 |
| Test 1 | - | - | - | - | |
| Test 2 | - | - | - | - | |
| Avg | - | - | - | - |
| Test | ΔHc [kJ g-1] |
|---|---|
| 35 kW m-2 (Test 1) | 24.73 |
| 35 kW m-2 (Test 2) | 25.30 |
| 50 kW m-2 (Test 1) | 25.31 |
| 50 kW m-2 (Test 2) | 24.72 |
| 60 kW m-2 (Test 1) | 24.82 |
| 60 kW m-2 (Test 2) | 25.45 |
| 80 kW m-2 (Test 1) | - |
| 80 kW m-2 (Test 2) | - |
| Average | 25.06 |
| Std dev | 0.33 |
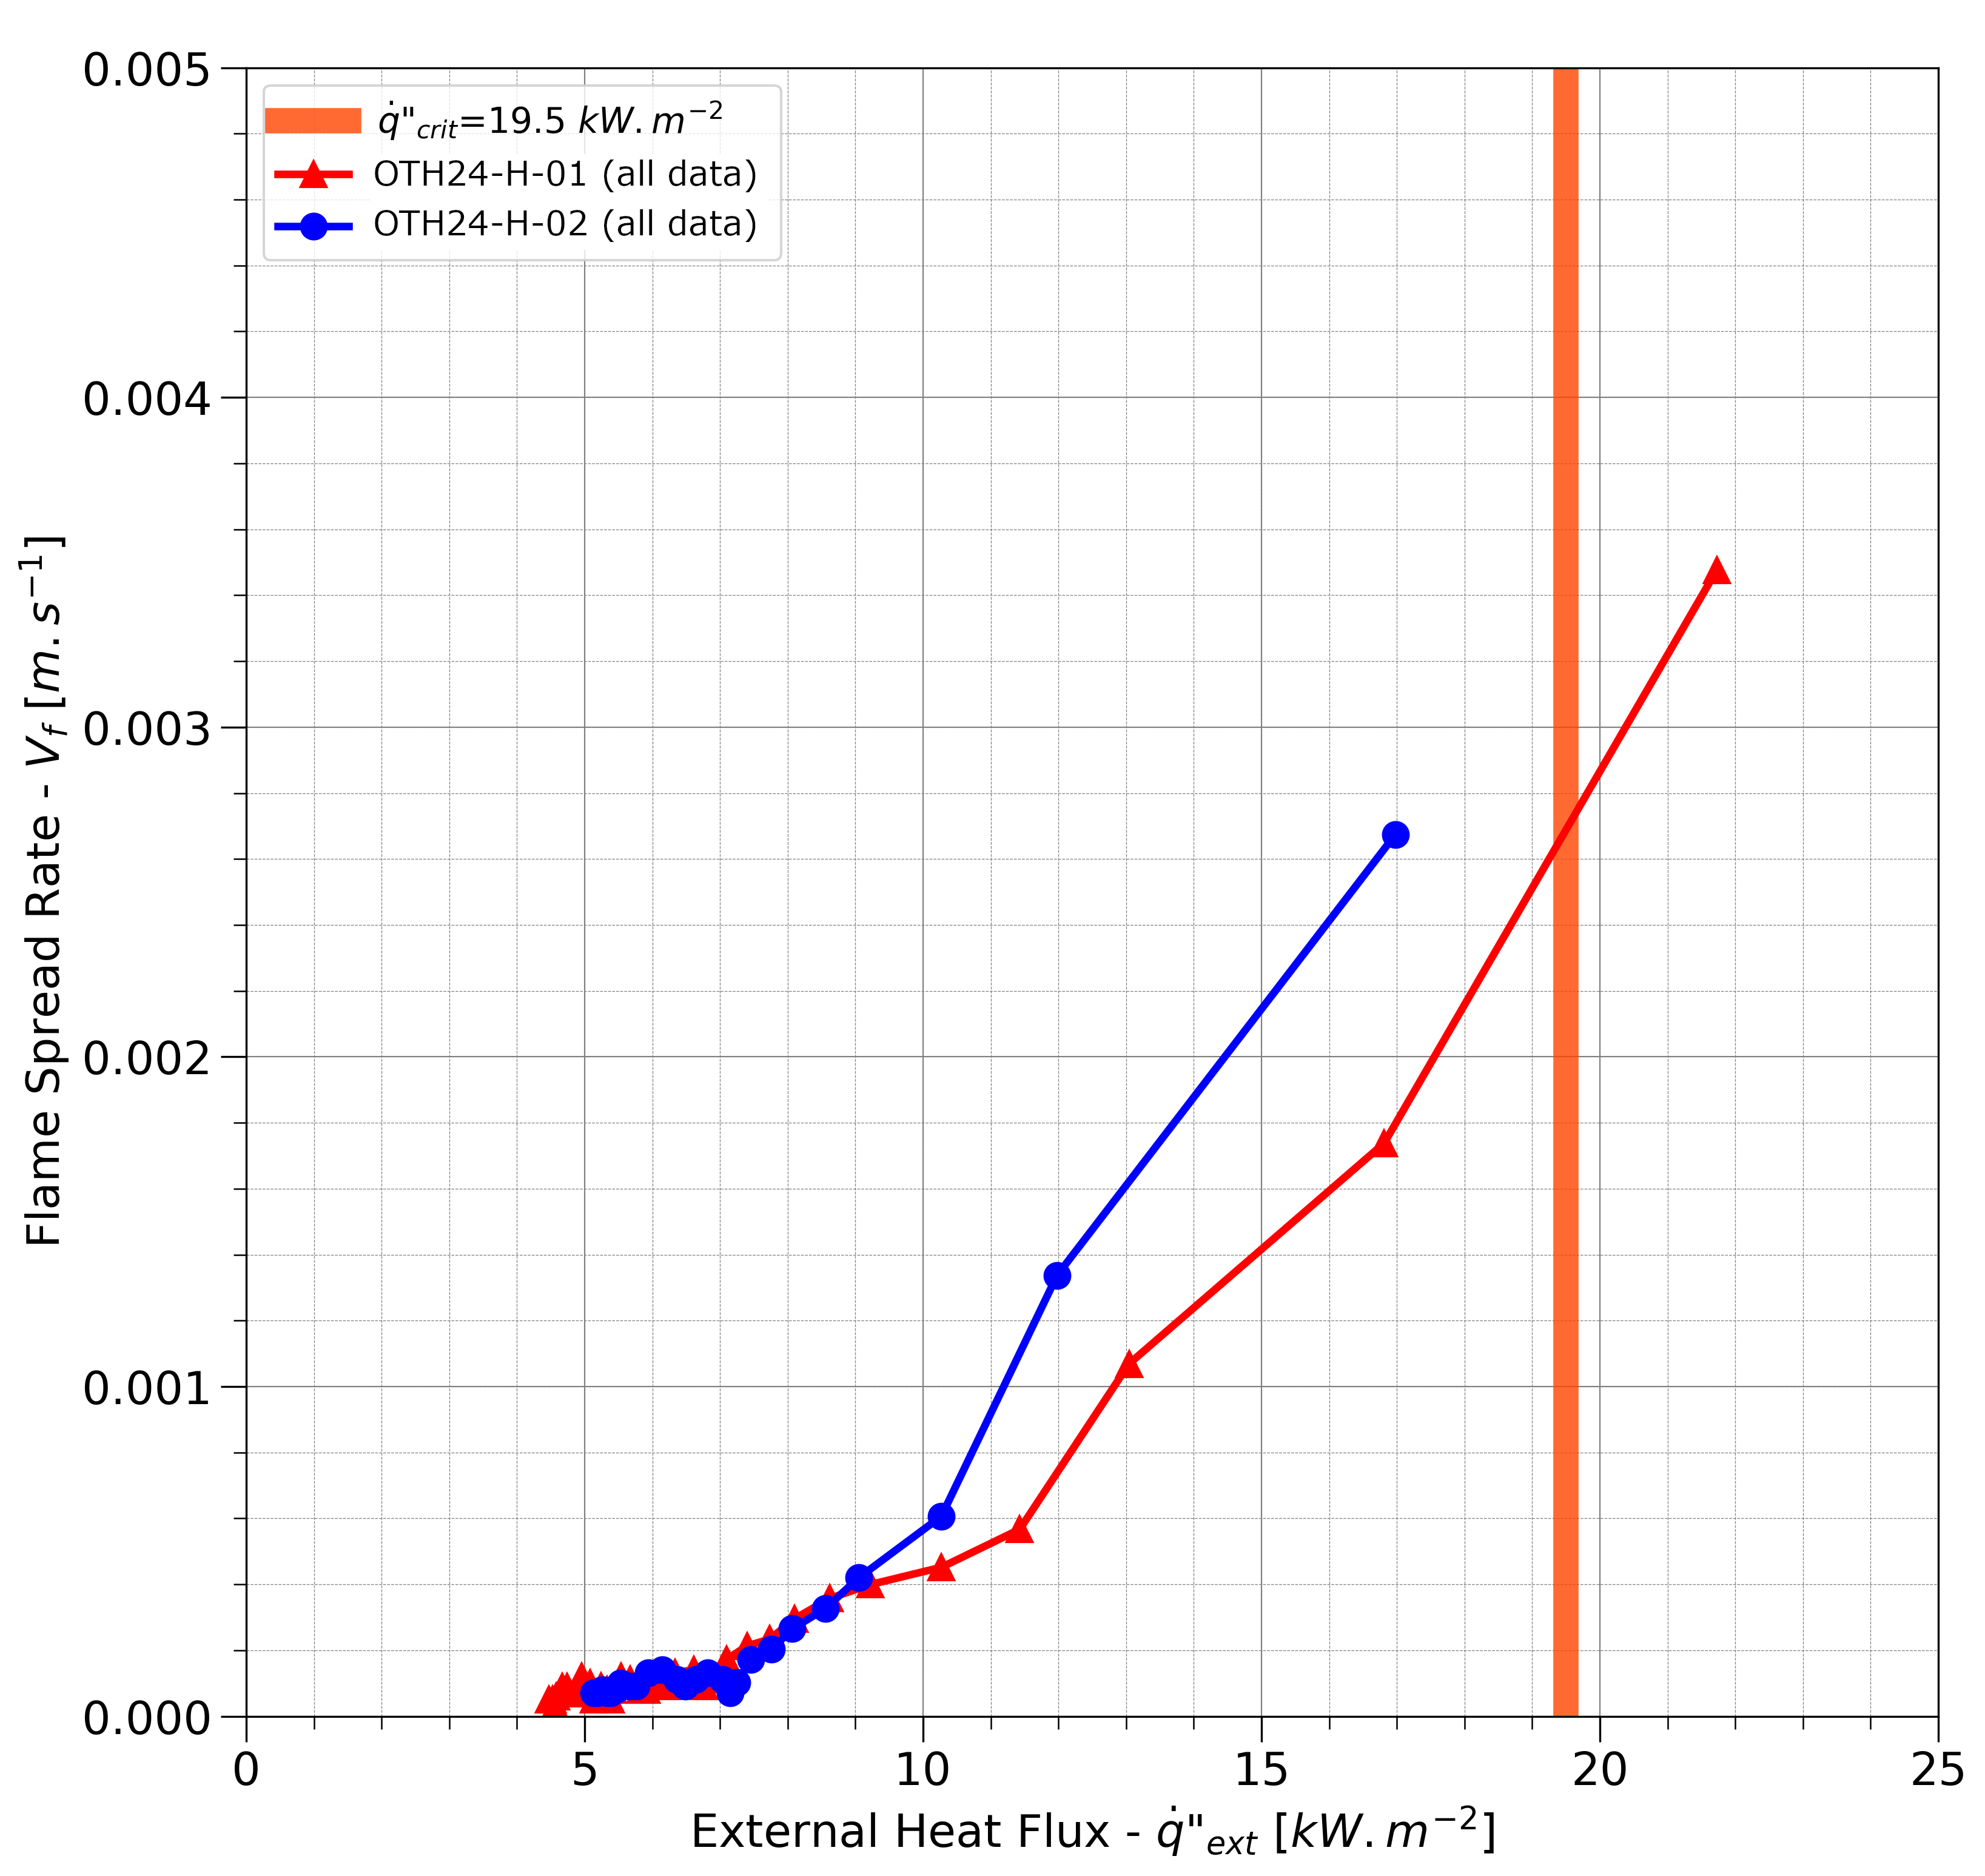
F. Flame Spread
| Orientation | q̇″min.spread [kW m-2] | Vf.min [mm s-1] |
|---|---|---|
| Horizontal | 4.80 | - |
| Vertical | 4.20 | - |
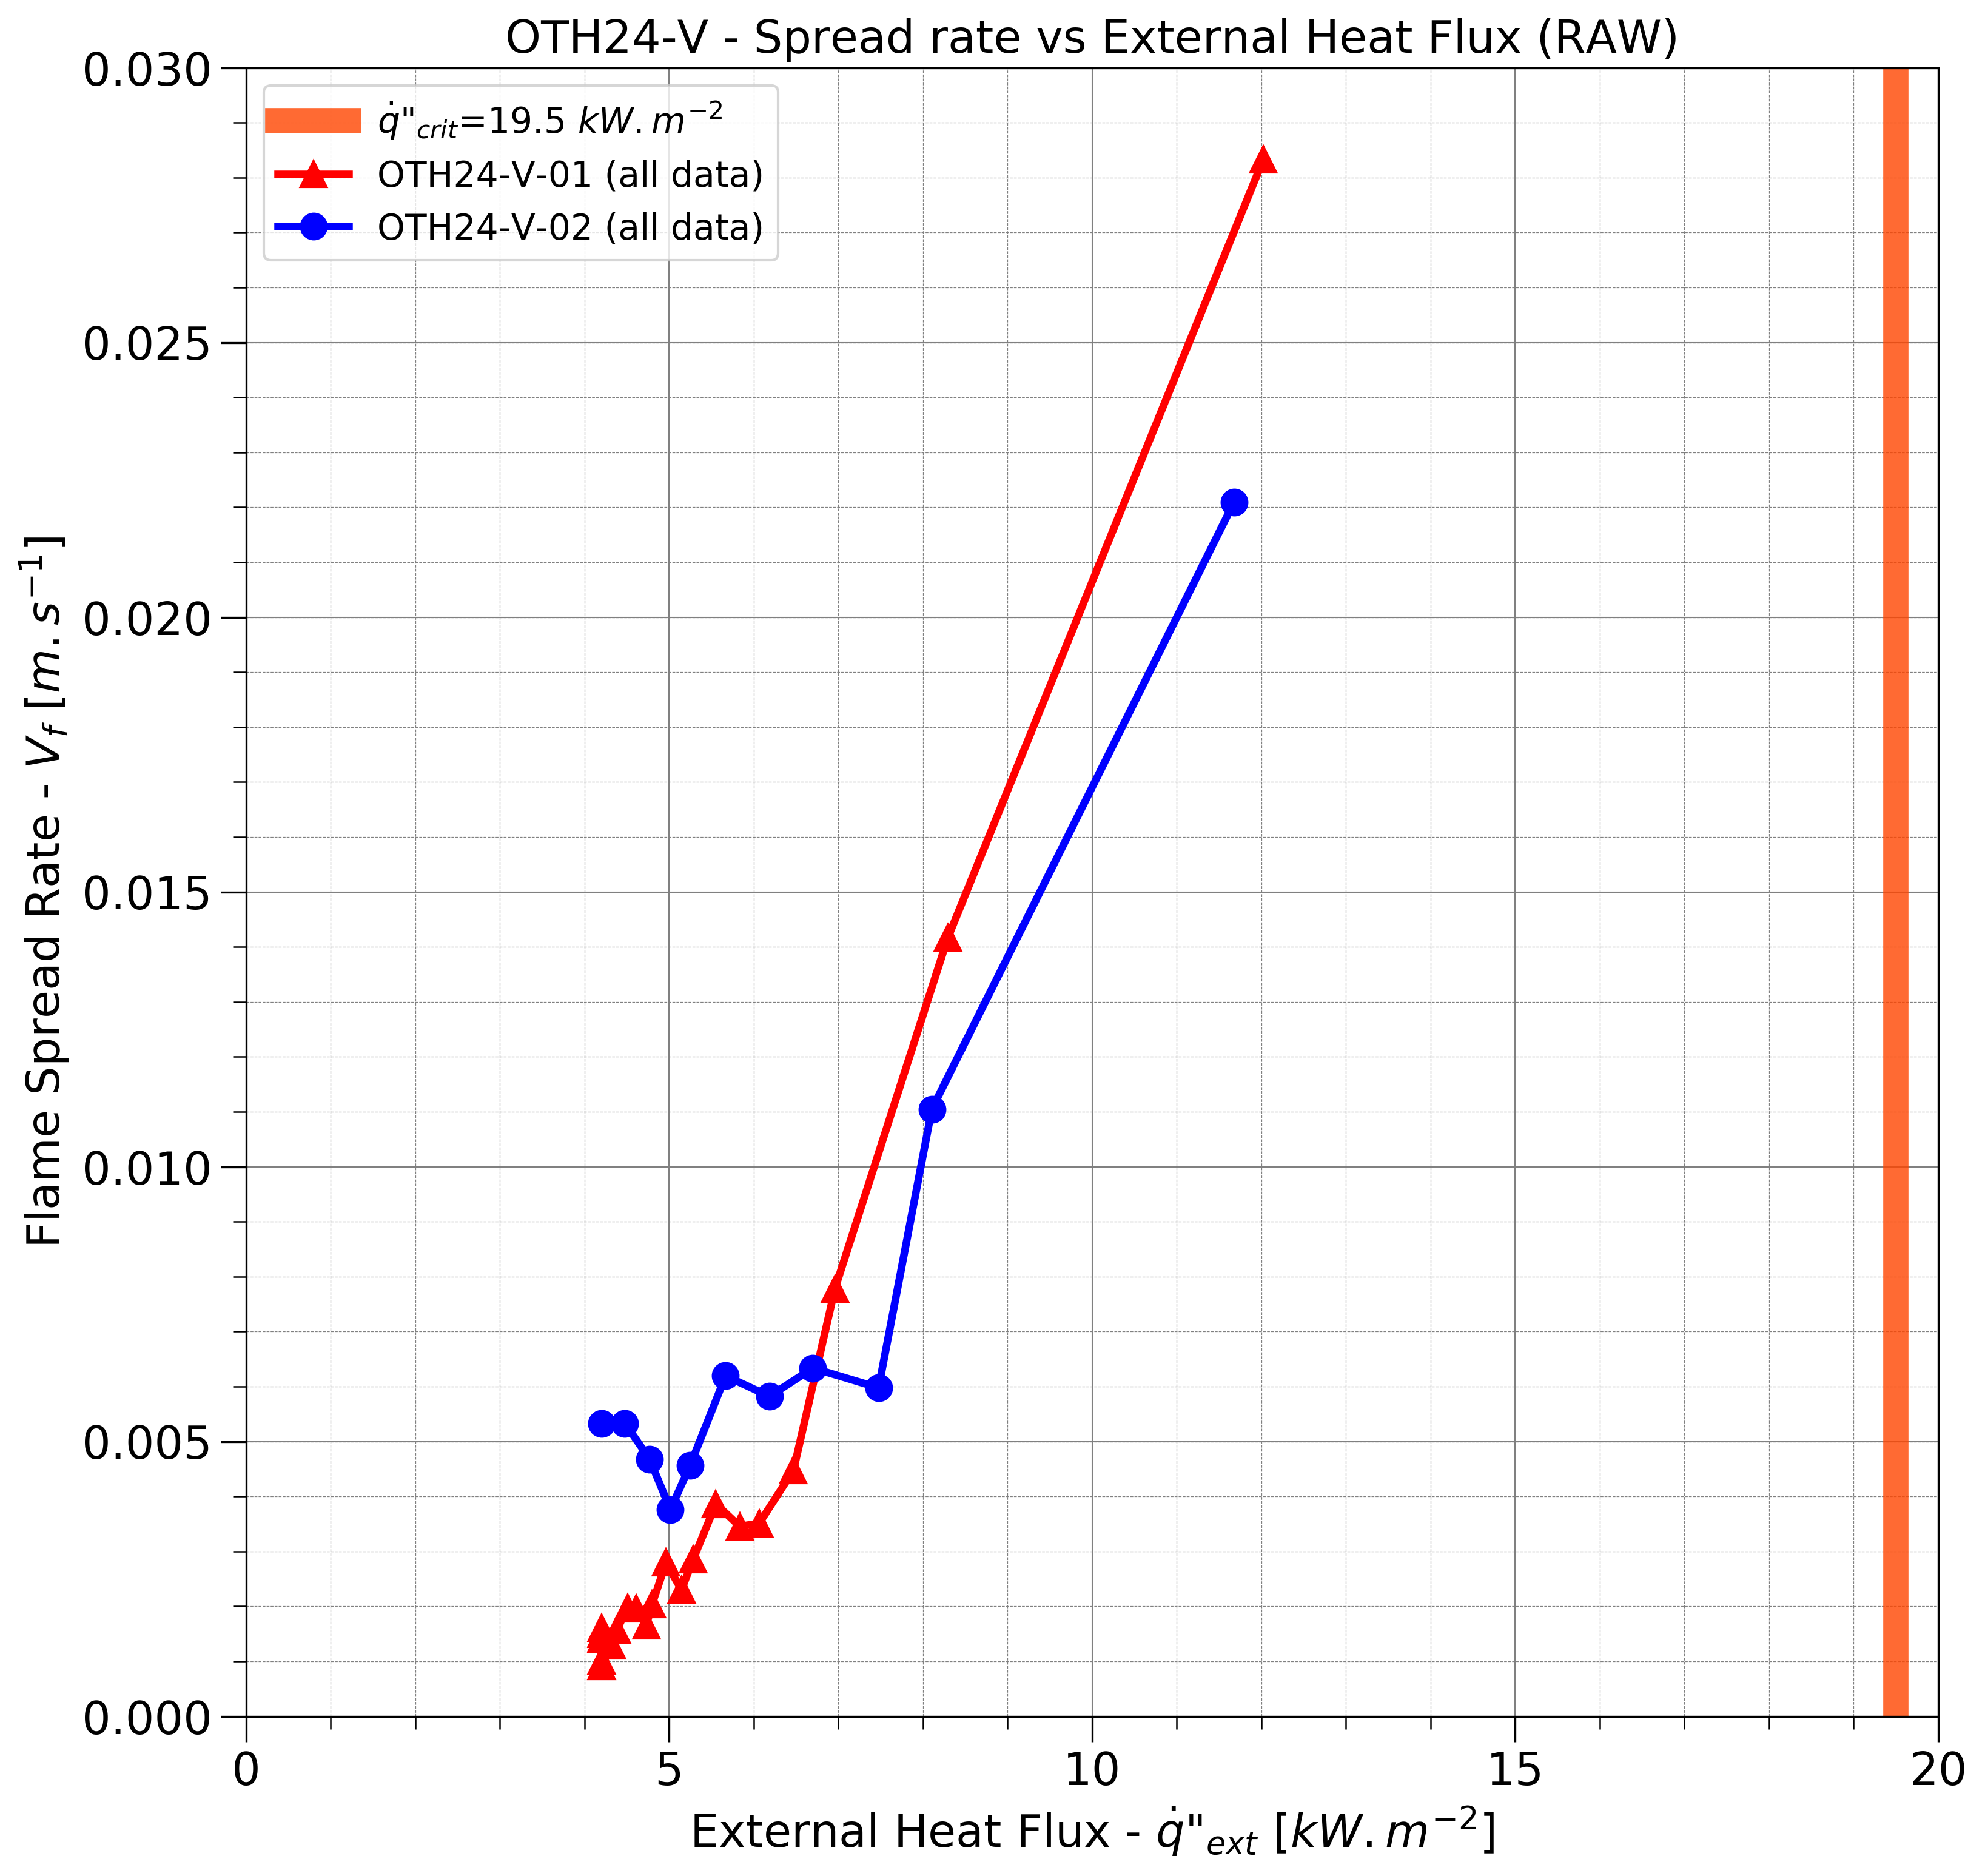
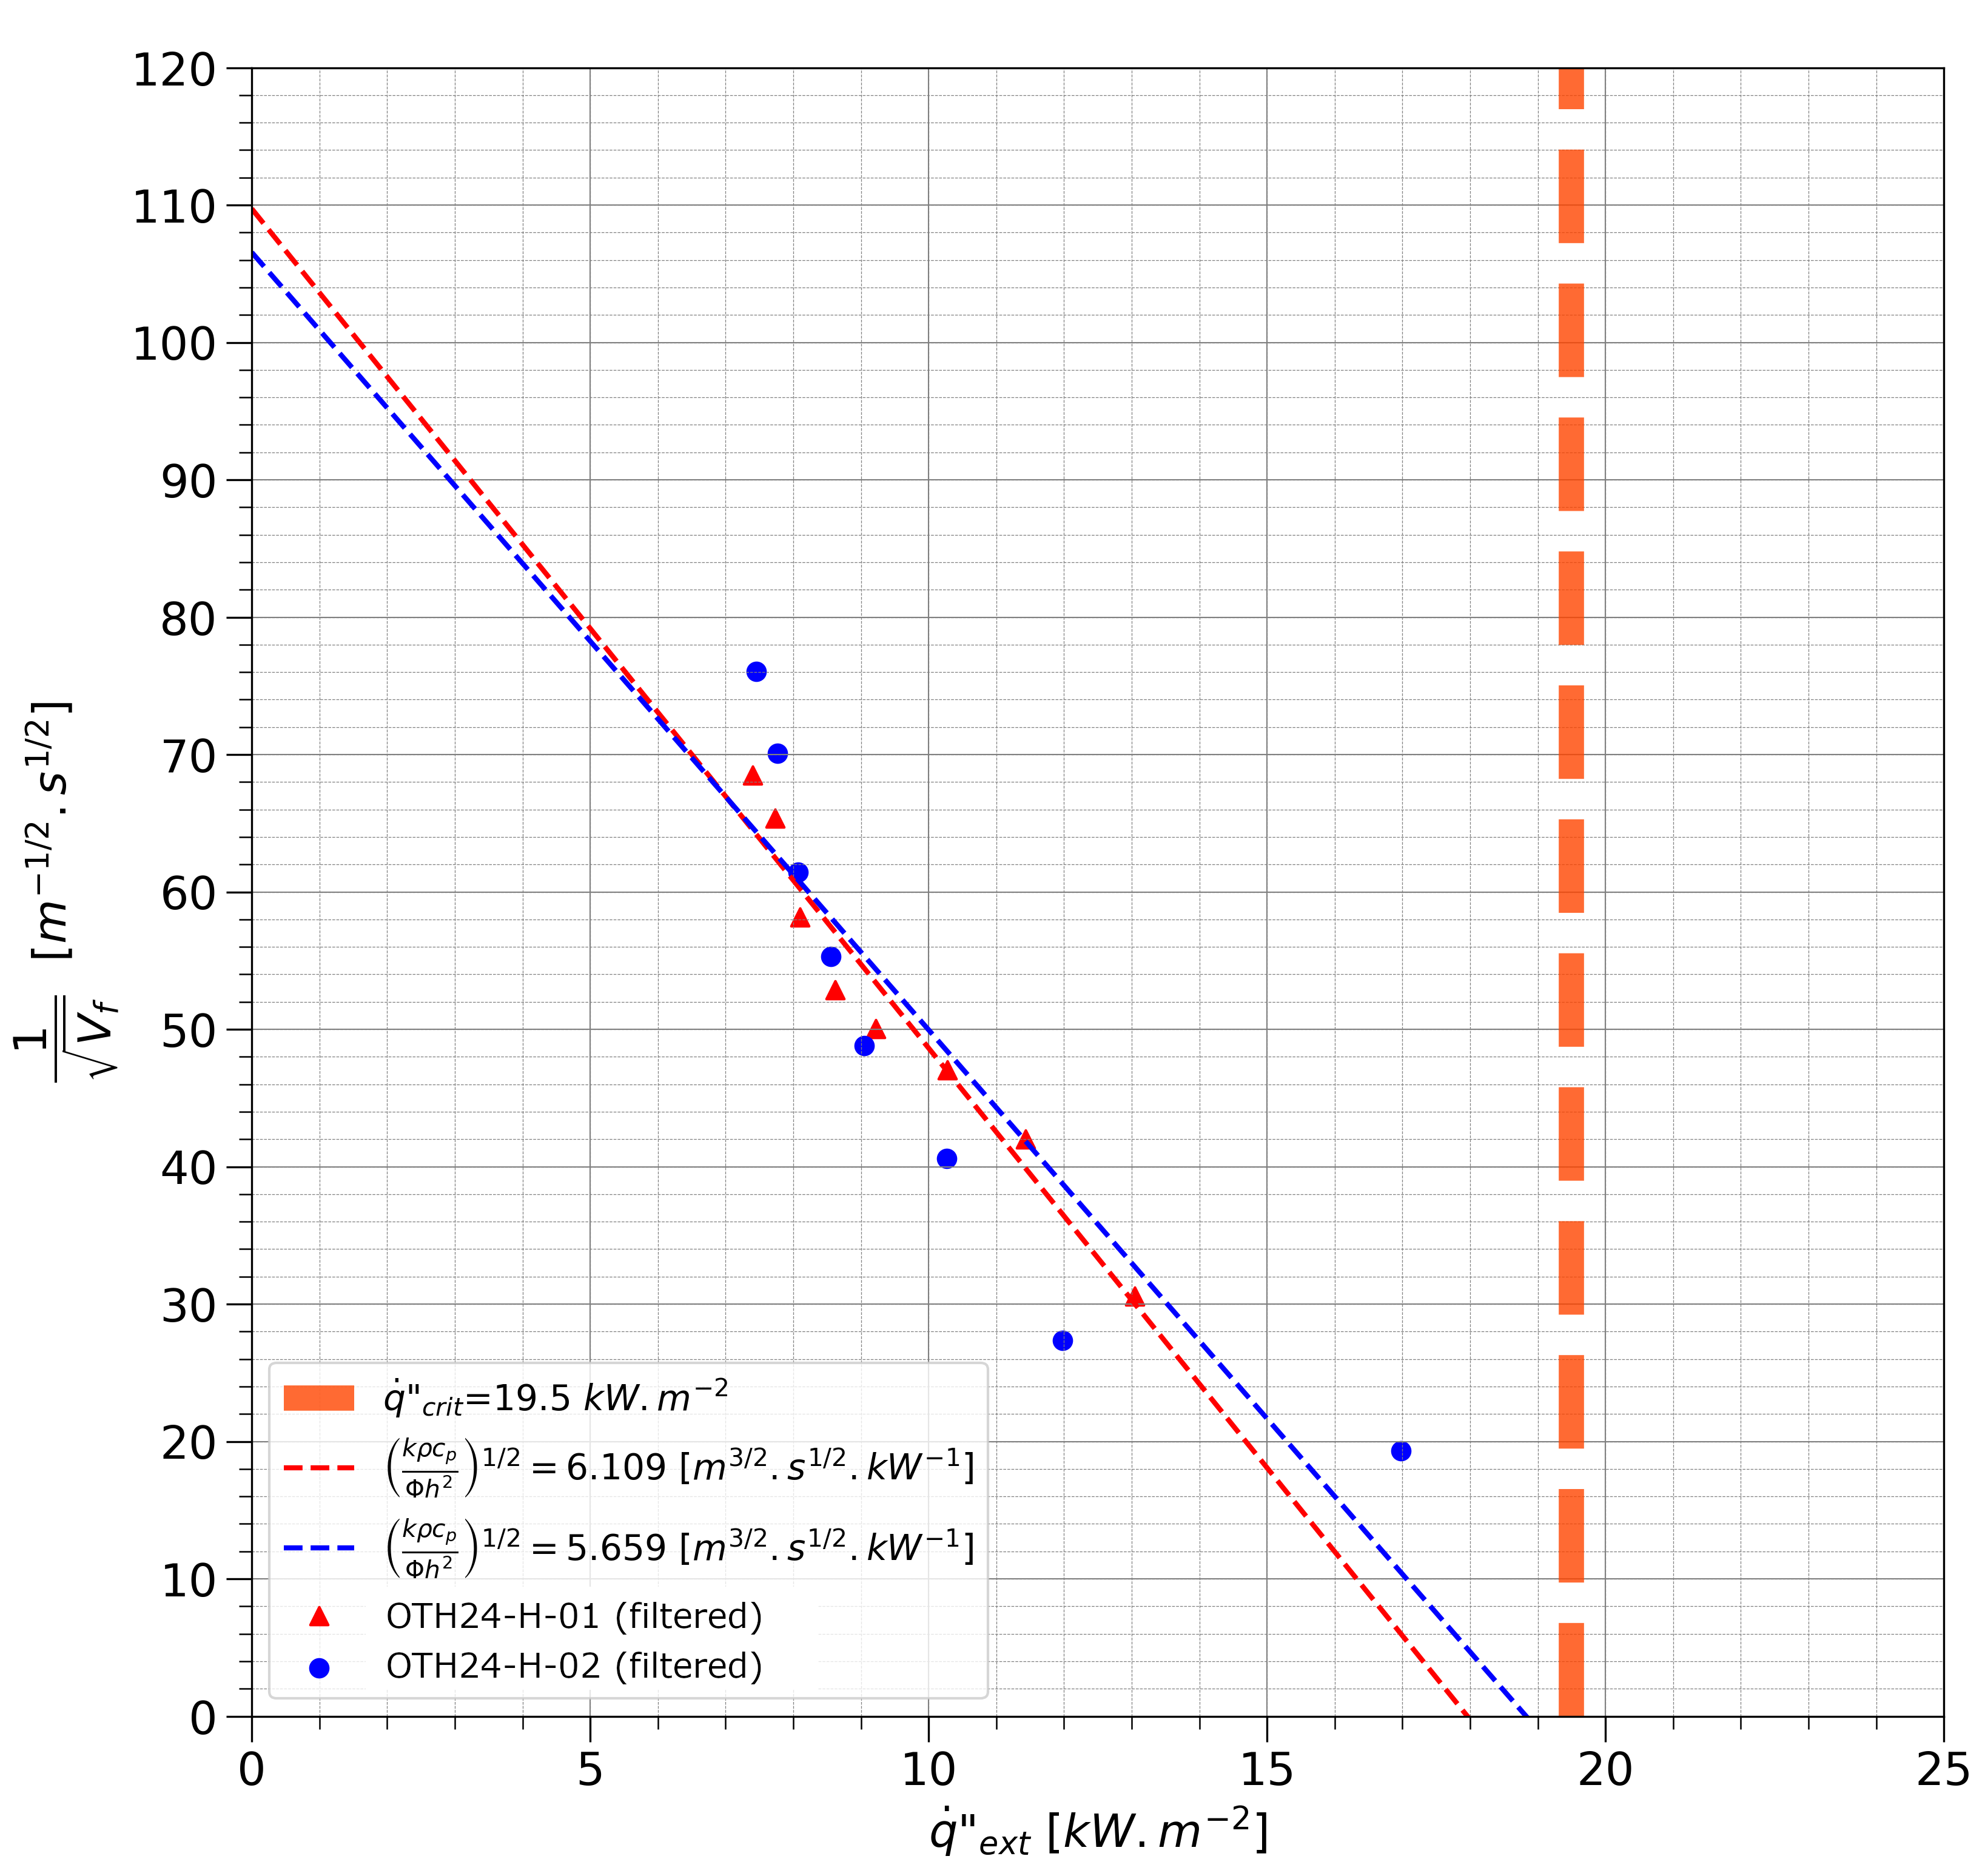
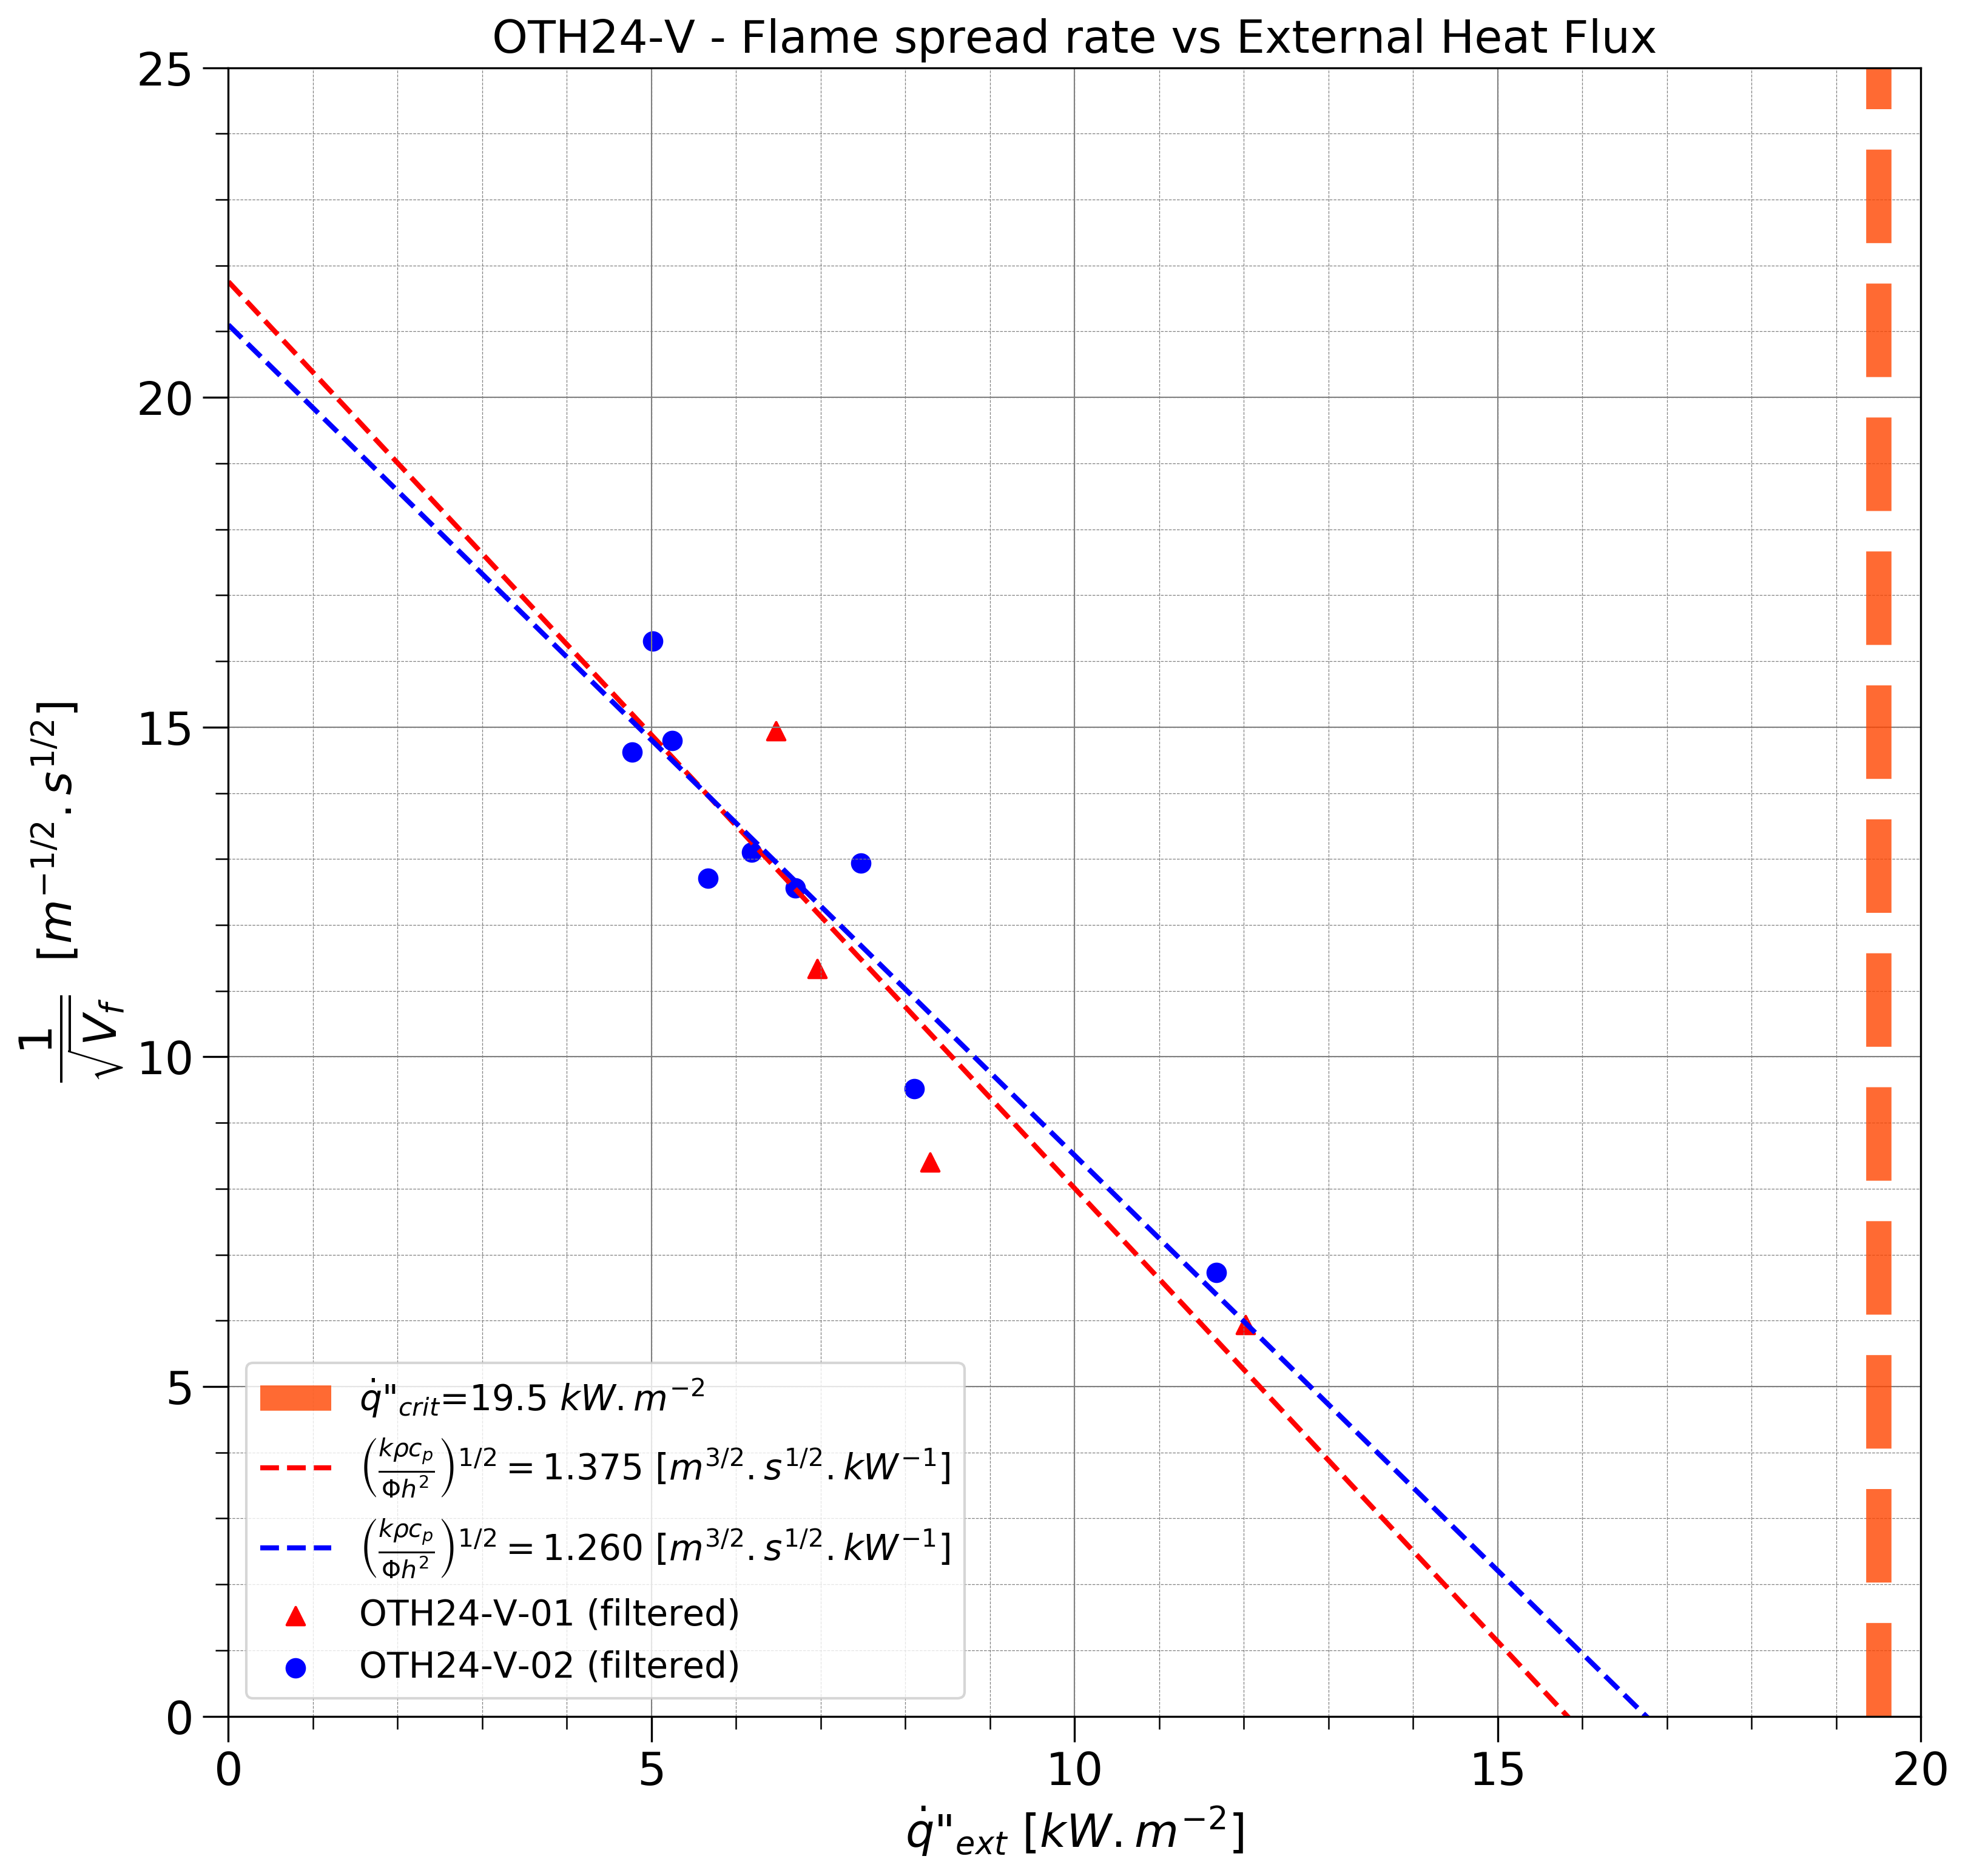
| Orientation | Trial | (kρcp⁄Φh2)1⁄2 [m3⁄2 s1⁄2 kW-1] | Φ [kW2 m-3] |
|---|---|---|---|
| Horizontal | 1 | 6.109 | 9.39 |
| Horizontal | 2 | 5.659 | 10.94 |
| Vertical | 1 | 1.375 | 185.30 |
| Vertical | 2 | 1.26 | 220.85 |