Material description
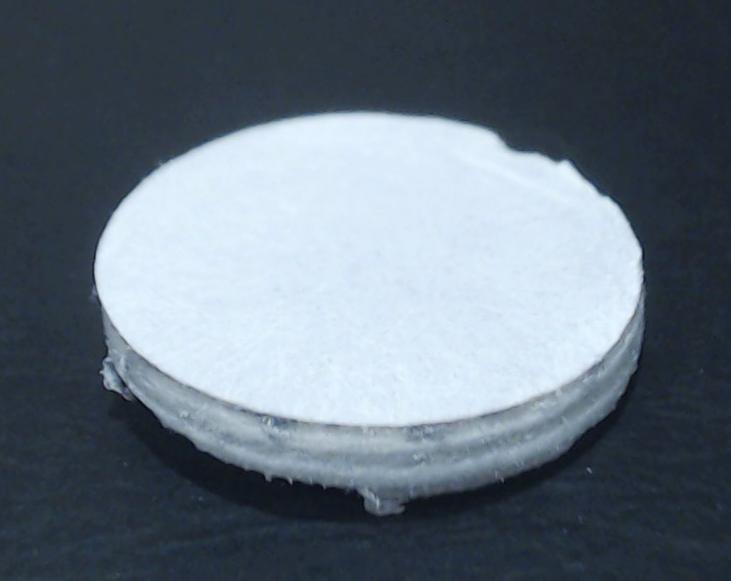
Material ID: ACP35
Material type: Aluminium composite panel with a core consisting of polyethylene (PE) and a fire retardant.
Polymer: Polyethylene (39%)
Additives (fire retardants, fillers or traces of inorganic elements): Magnesium Hydroxide (56%), Calcium (2%), Silicon (1%), Titanium (1%), Sodium (1%), traces of other elements (<1%)
Core thickness: 2.97mm
Thickness of single metal skin: 0.5mm
| Compound | Mass Concentration (%) |
|---|---|
| Polyethylene (PE) | 39 |
| Magnesium Hydroxide (Mg(OH)2) | 56 |
| Calcium (Ca) | 2 |
| Silicon (Si) | 1 |
| Titanium (Ti) | 1 |
| Sodium (Na) | 1 |
| Traces of sulfur (S) | <1 |
| Traces of iron (Fe) | <1 |
| Traces of chlorine (Cl) | <1 |
| Traces of potassium (K) | <1 |
A. Material composition identification
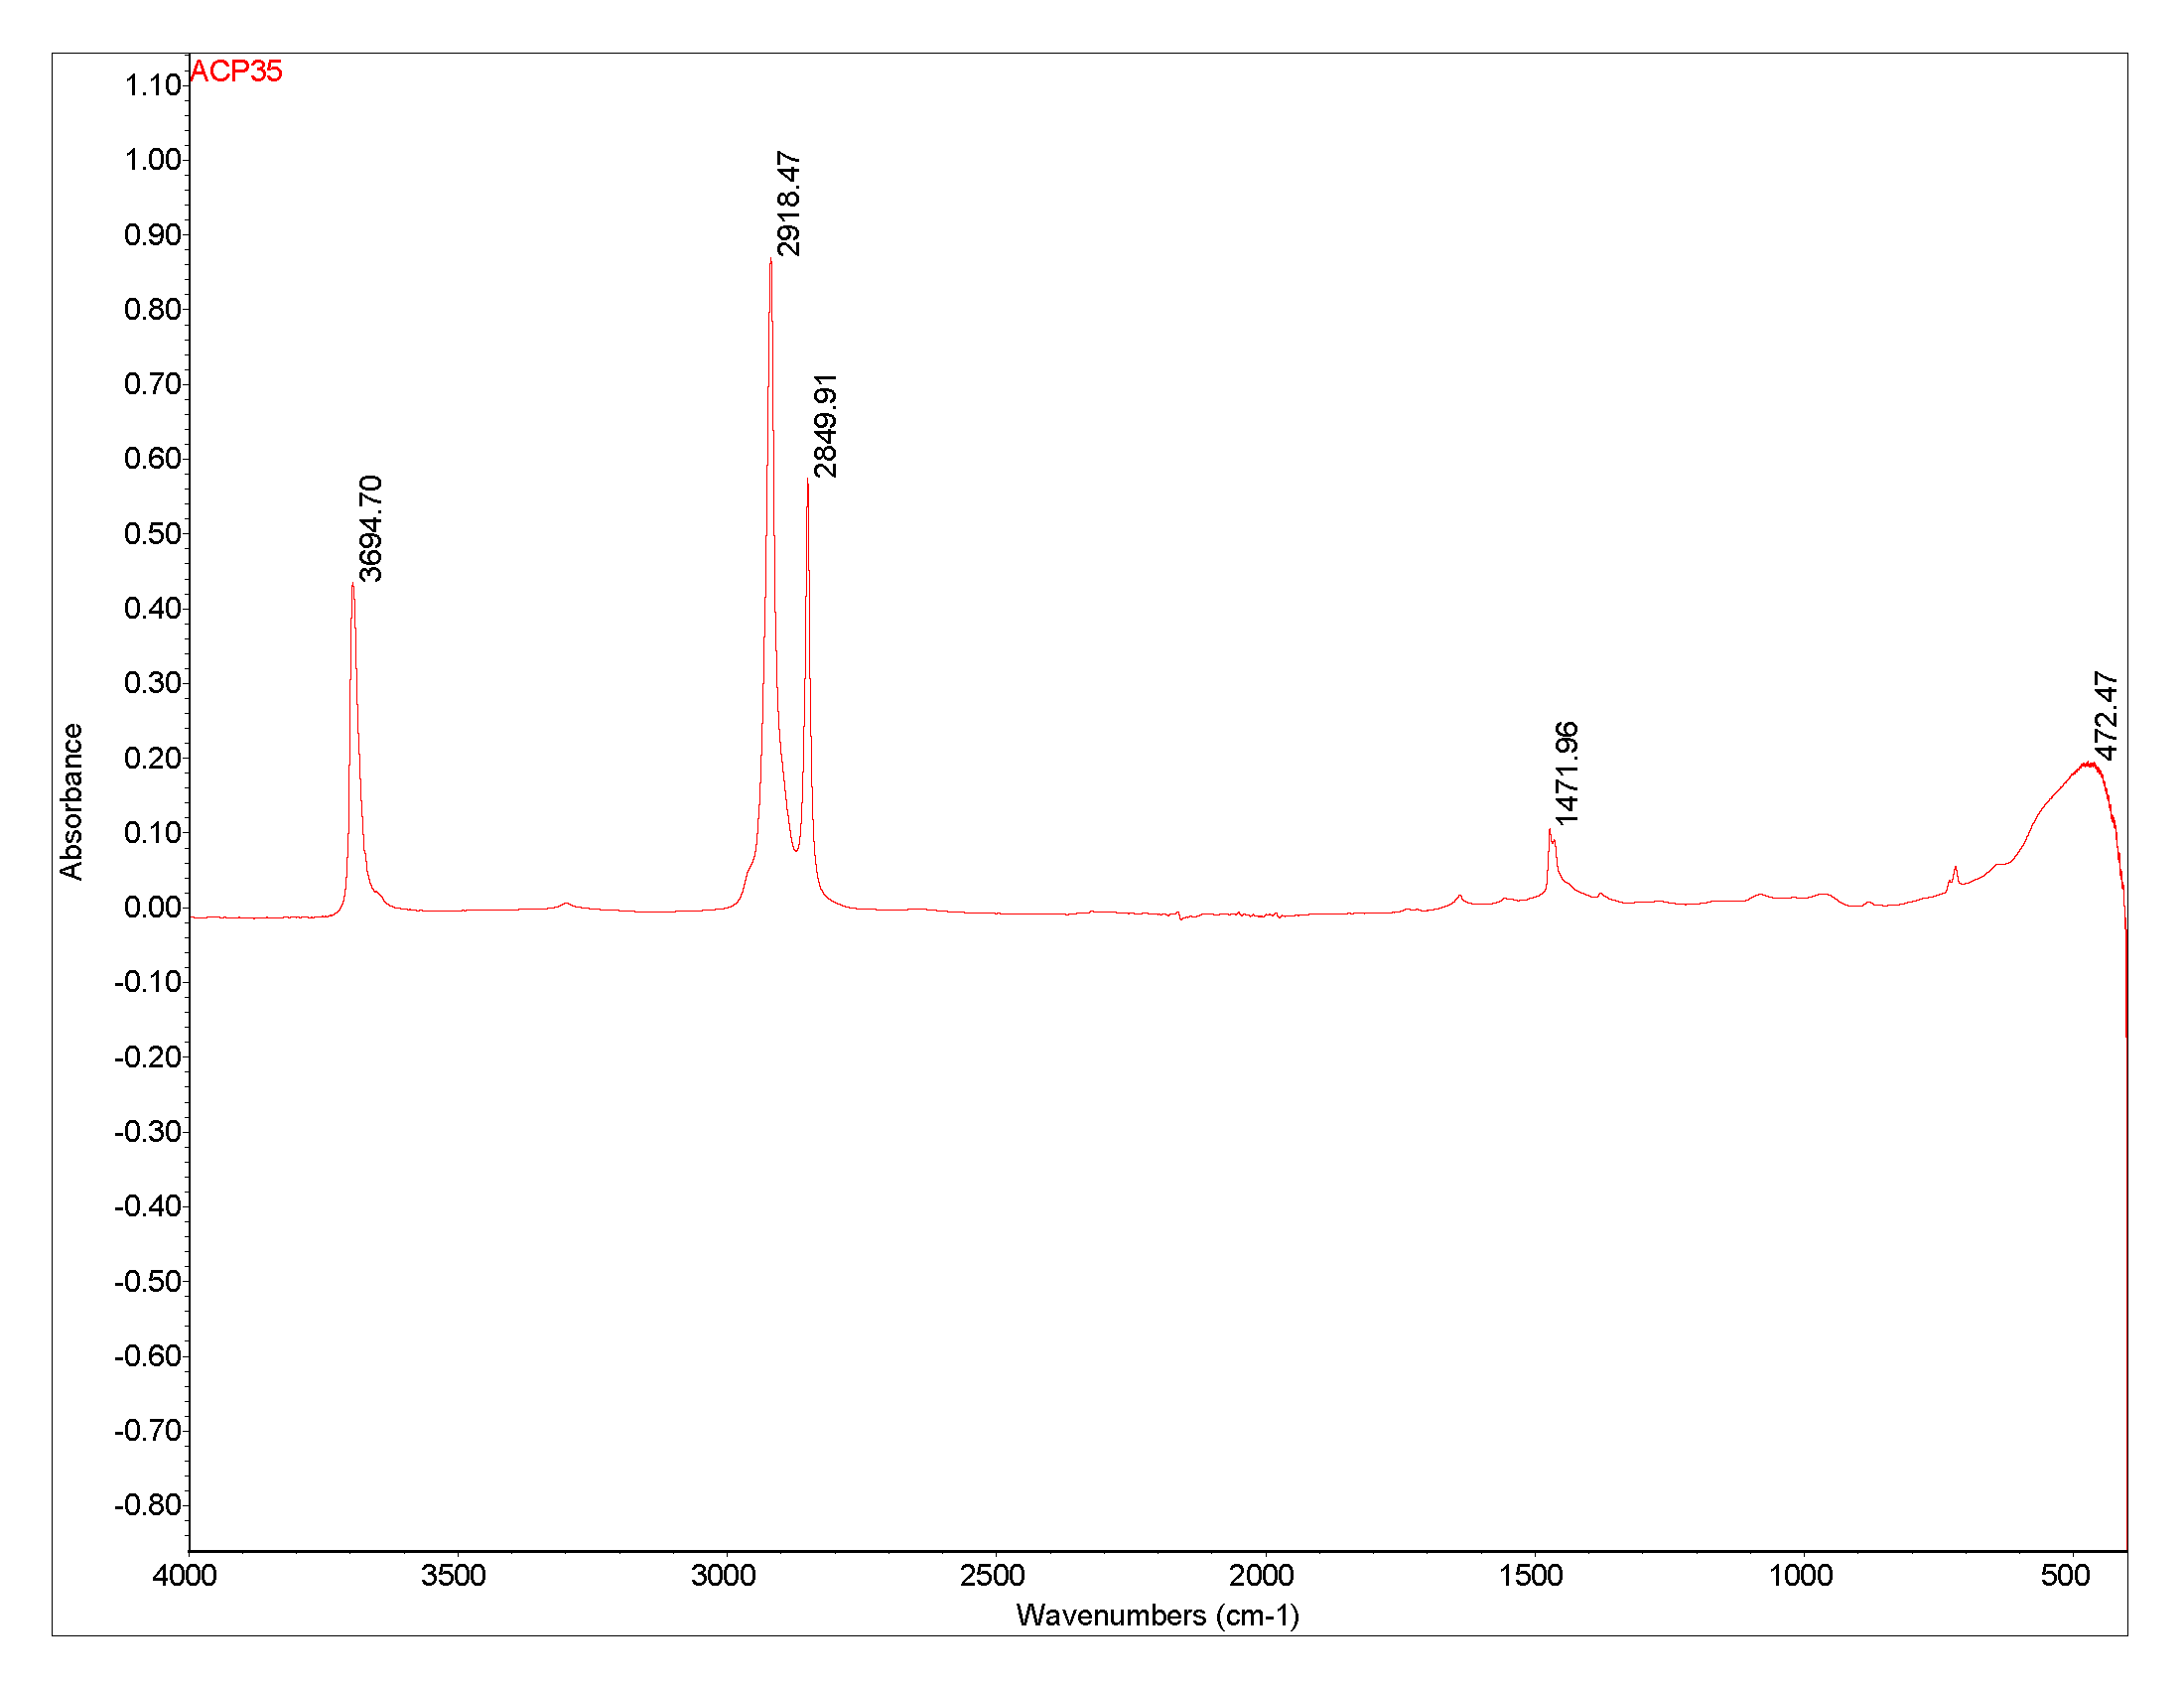
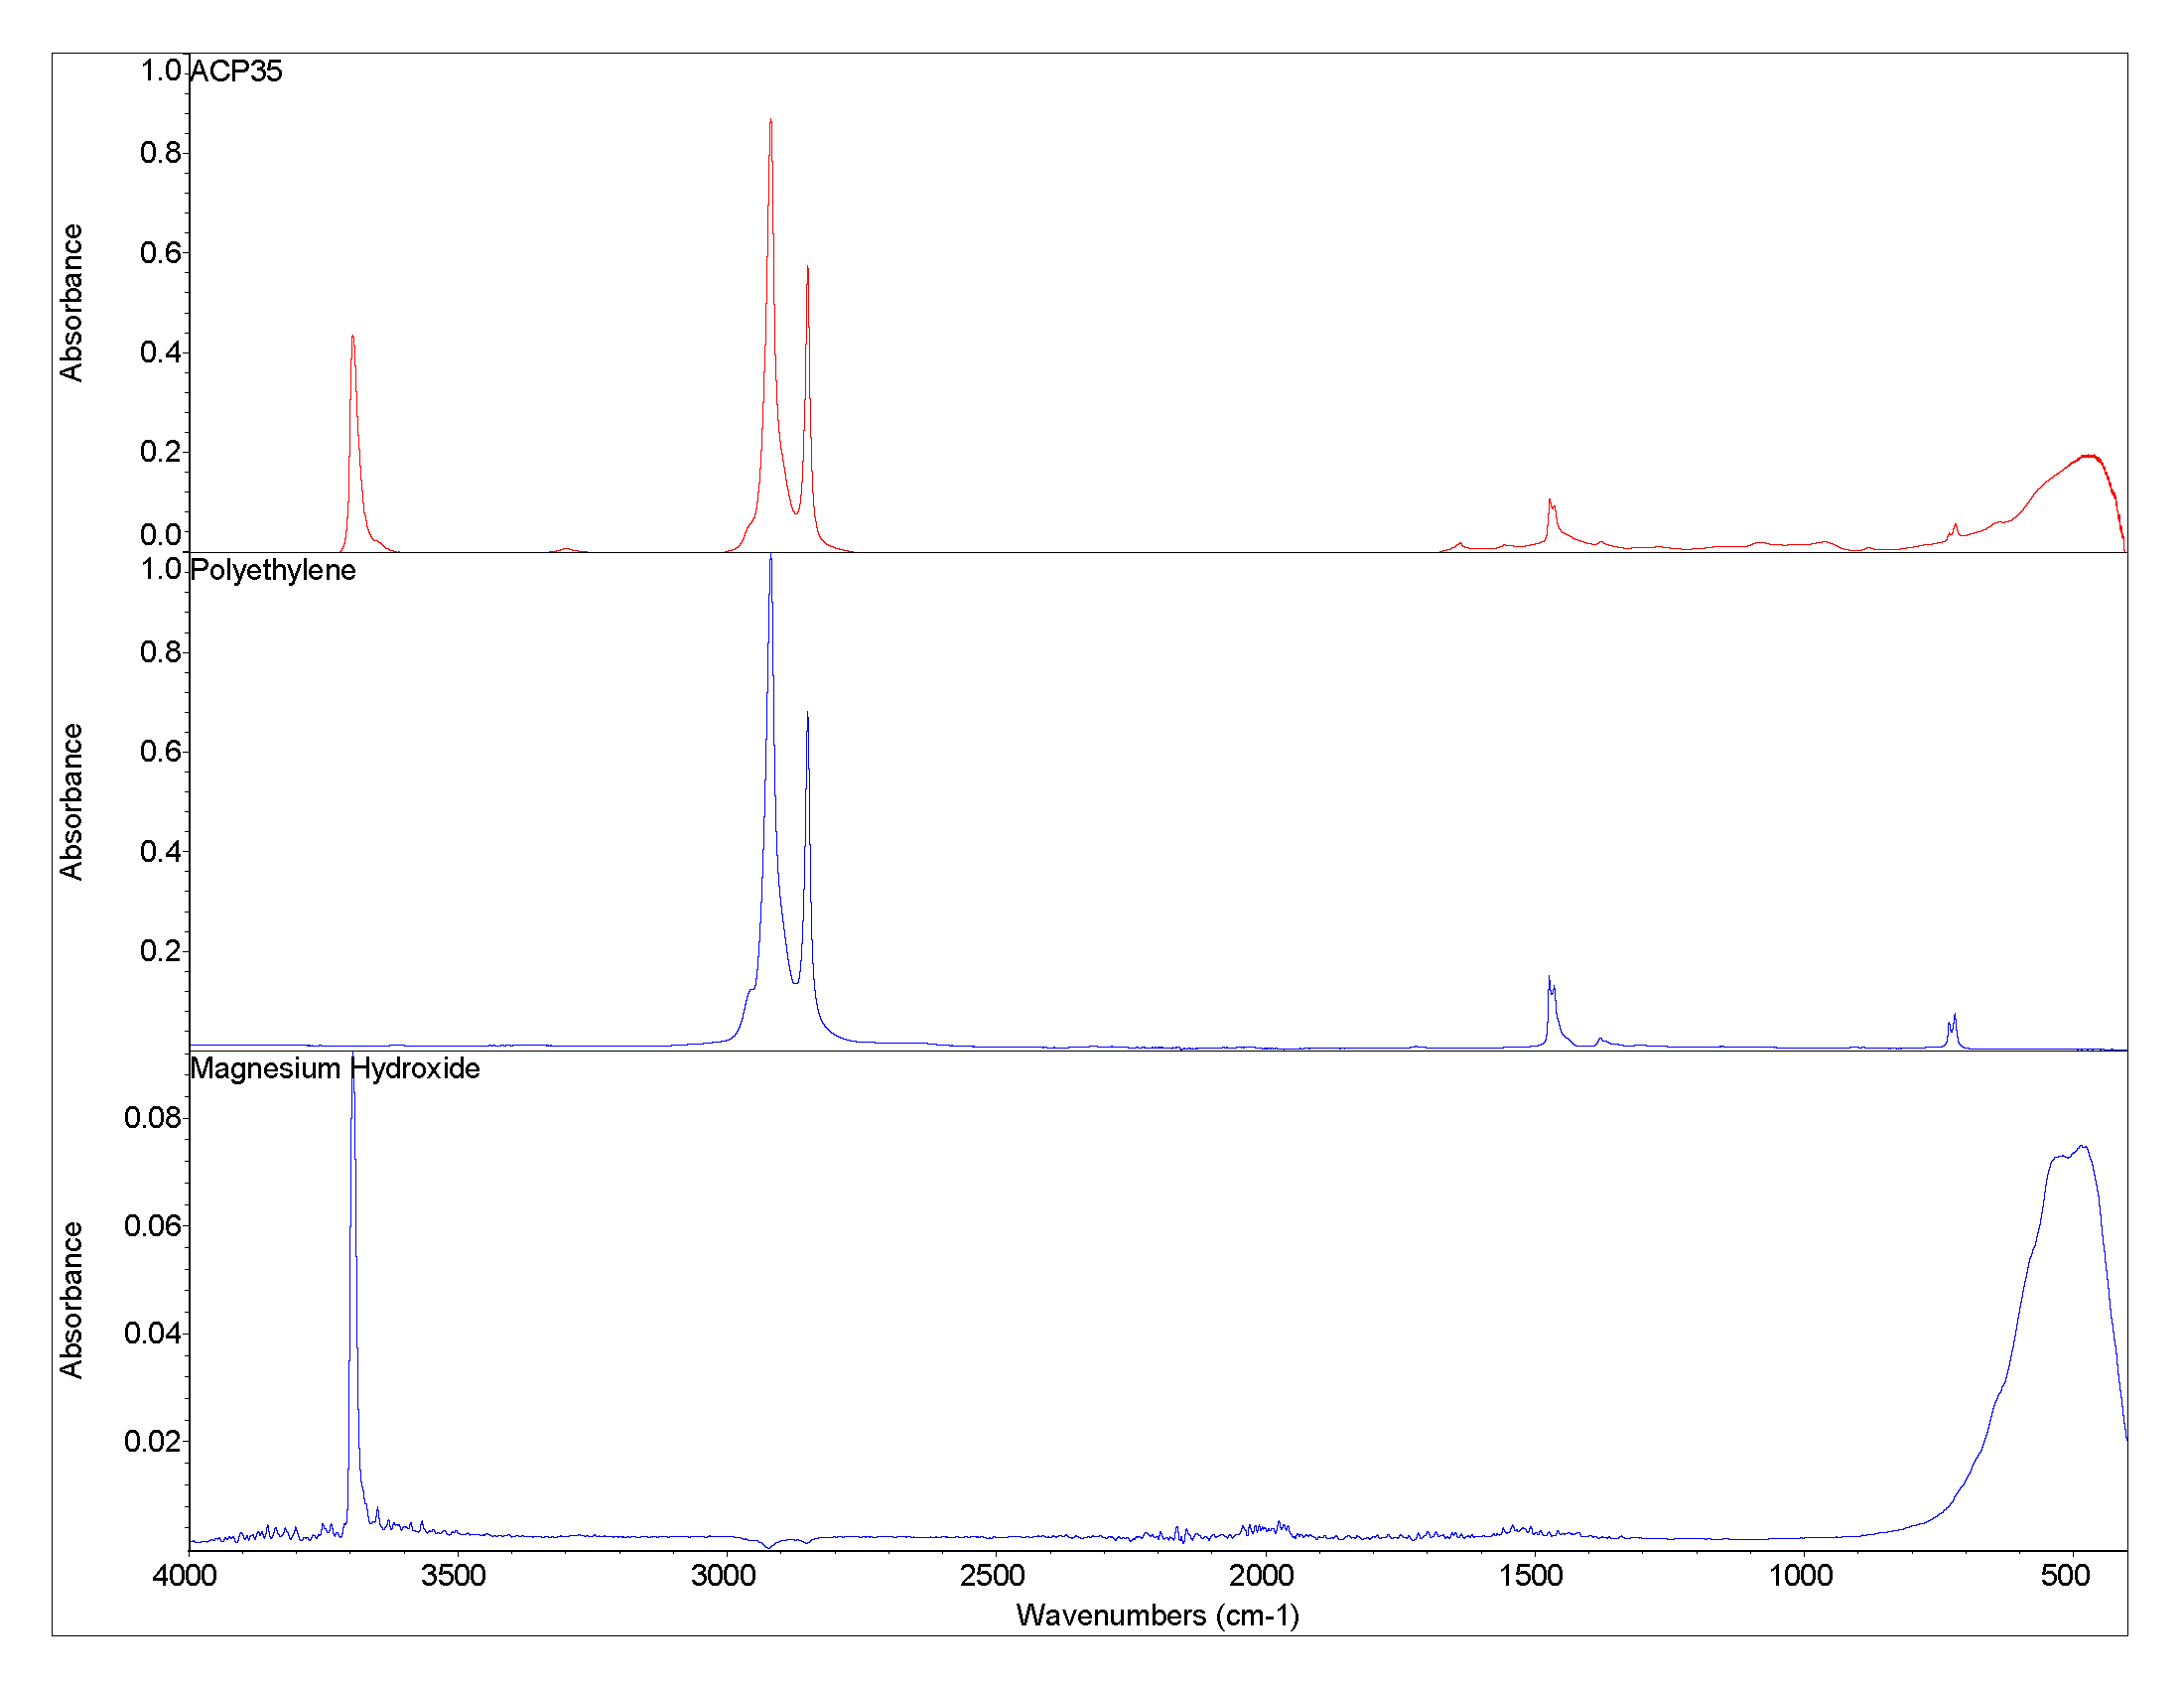
A.1 Attenuated total reflection – Fourier transform infrared spectroscopy (ATR-FTIR)
| Identified Compounds |
|---|
| Polyethylene (PE) |
| Magnesium Hydroxide (Mg(OH)2) |
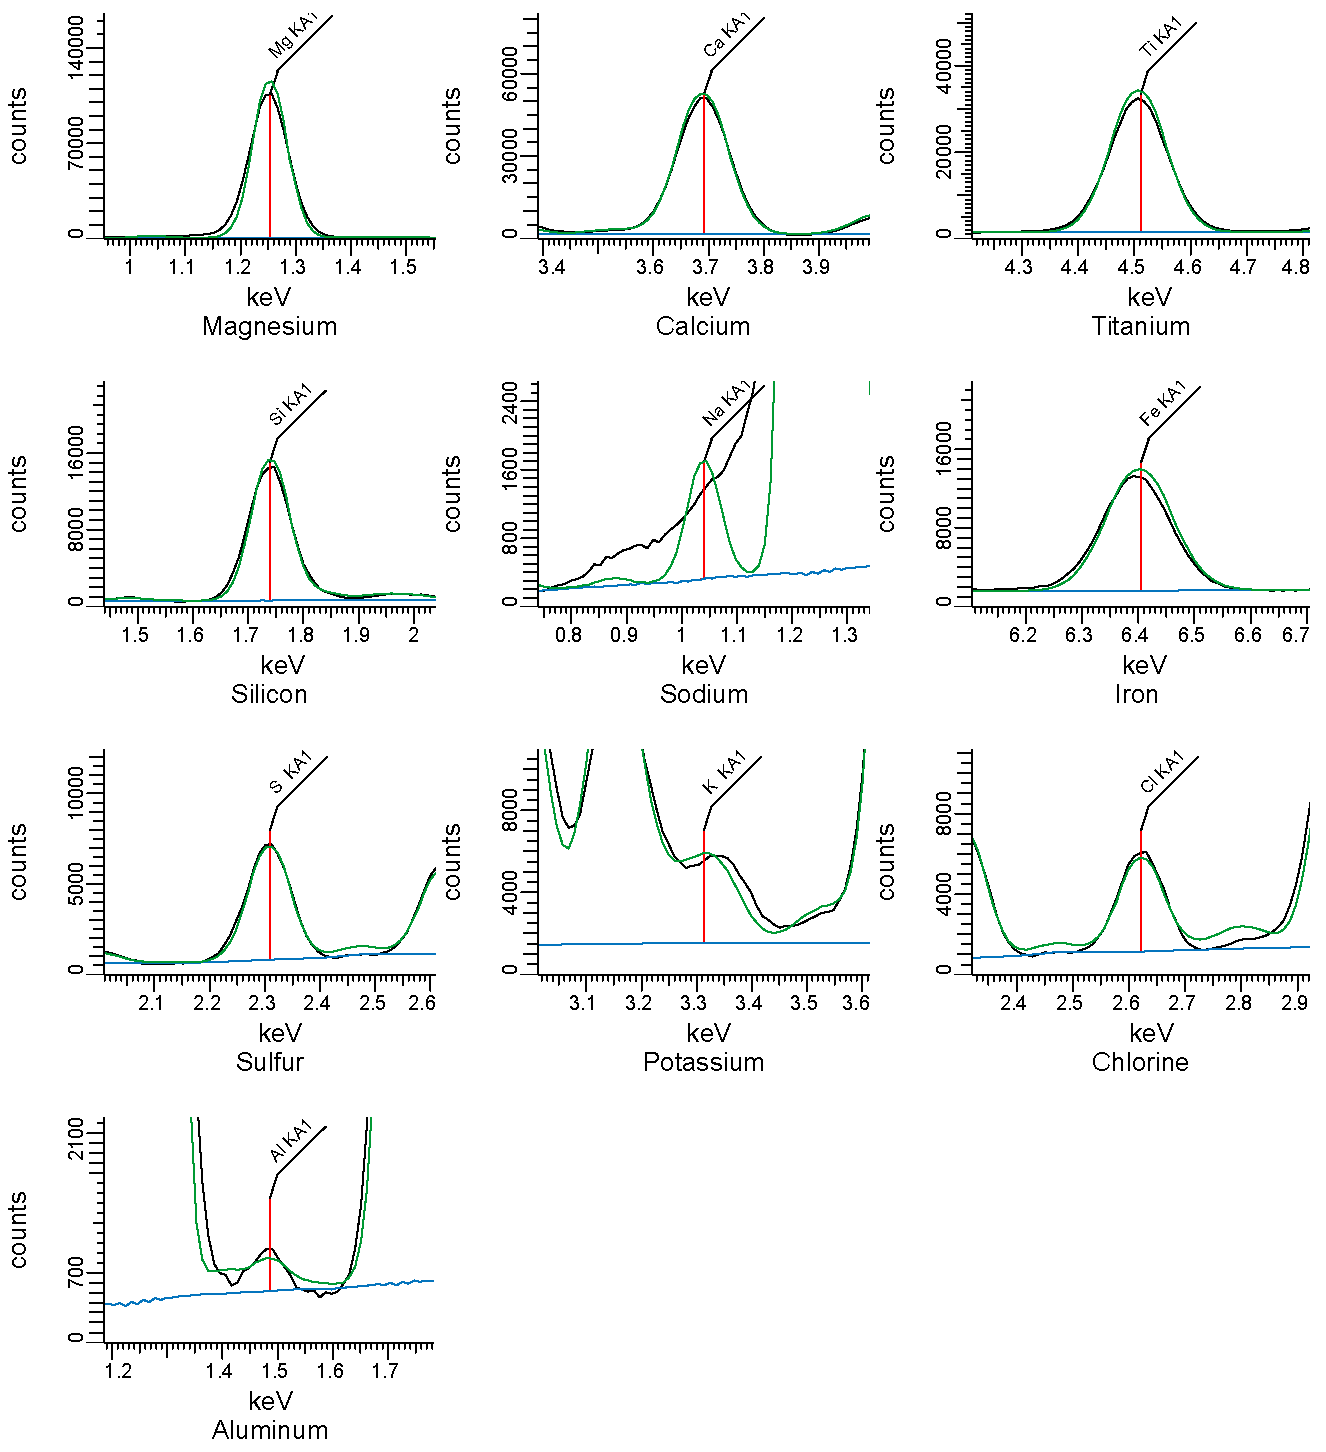
A.2 Energy Dispersive X-Ray Fluorescence (EDXRF)
| Element | Mass Concentration (%) |
|---|---|
| Mg | 20 |
| Ca | 3 |
| Ti | 2 |
| Si | 1 |
| Na | 1 |
| Fe | <1 |
| S | <1 |
| Cl | <1 |
| Mn | <1 |
| K | <1 |
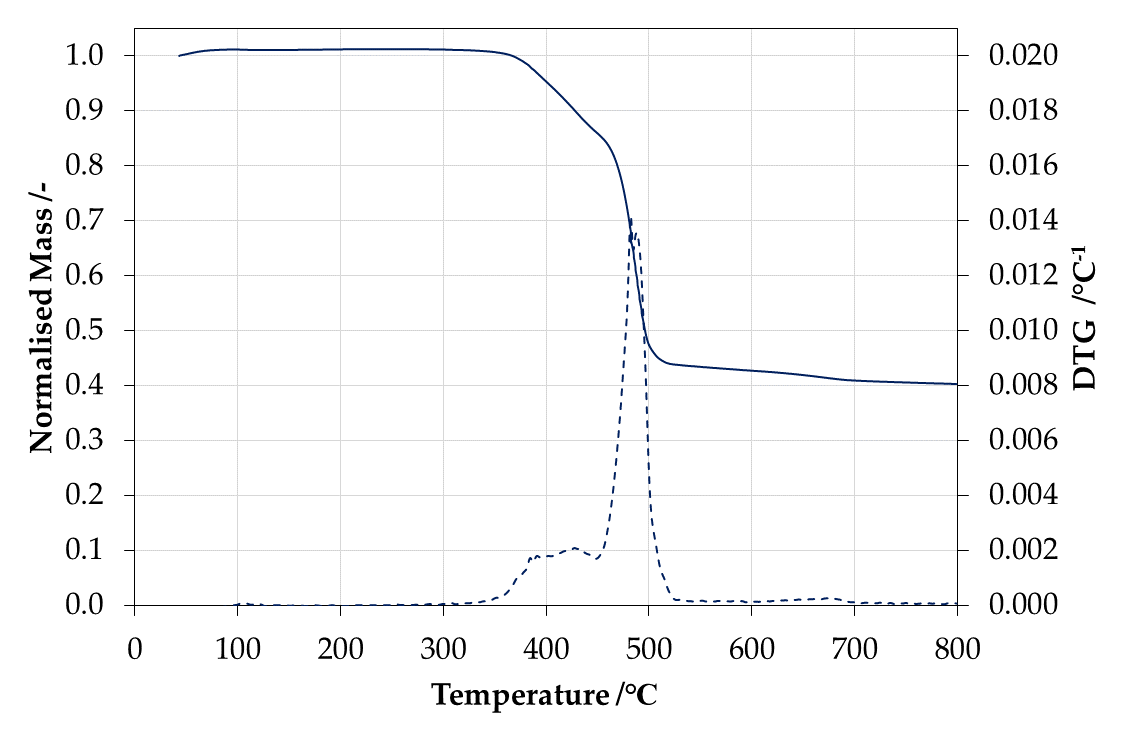
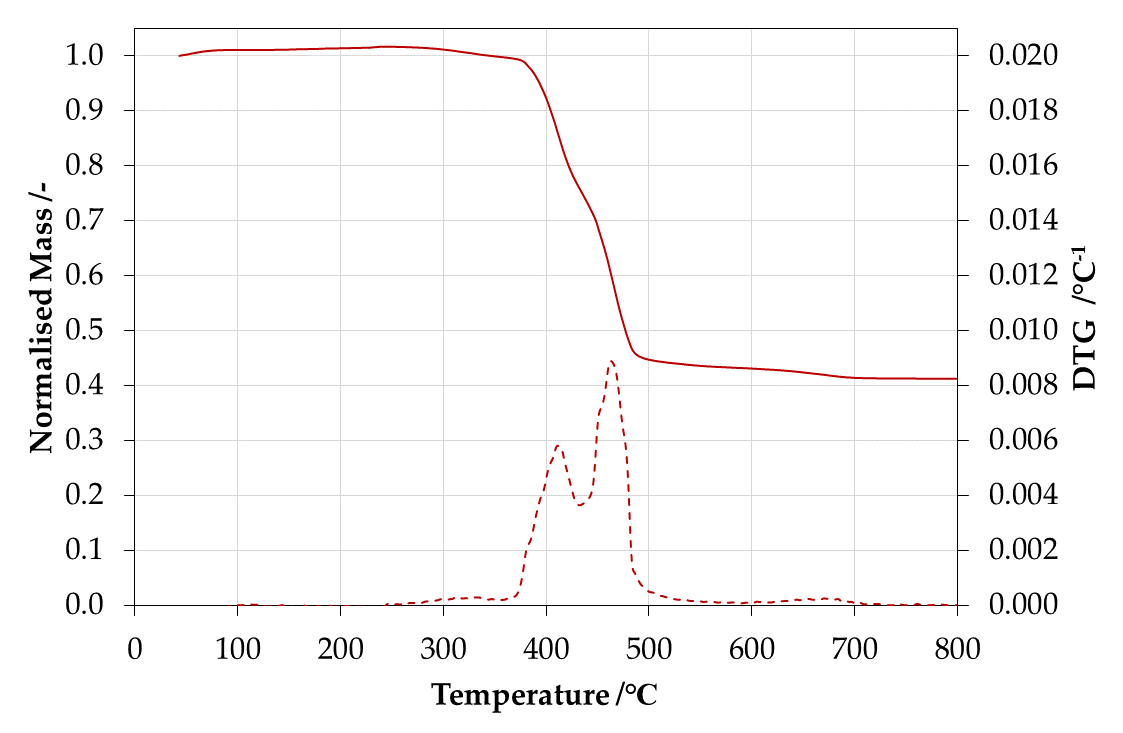
B. Thermogravimetric analysis
| Condition | Fraction of mass residue at 800°C |
|---|---|
| Non-oxidative (nitrogen) | 0.40 |
| Oxidative (air) | 0.41 |
| Peak ID | Temperature peak (°C) | Amplitude of peak (°C-1) |
|---|---|---|
| Peak 1 | 428 | 2.08 x 10⁻³ |
| Peak 2 | 482 | 1.416 x 10⁻² |
| Peak 3 | 673 | 2.5 x 10⁻⁴ |
| Peak ID | Temperature peak (°C) | Amplitude of peak (°C-1) |
|---|---|---|
| Peak 1 | 313 | 3 x 10⁻⁴ |
| Peak 2 | 411 | 5.8 x 10⁻³ |
| Peak 3 | 463 | 8.88 x 10⁻³ |
| Peak 4 | 670 | 2.4 x 10⁻⁴ |
C. Gross Heat of Combustion
| Trial | ΔHc [kJ g-1] |
|---|---|
| Trial 1 | 20.52 |
| Trial 2 | 20.55 |
| Trial 3 | 20.62 |
| Average | 20.56 |
| Std dev | 0.04 |
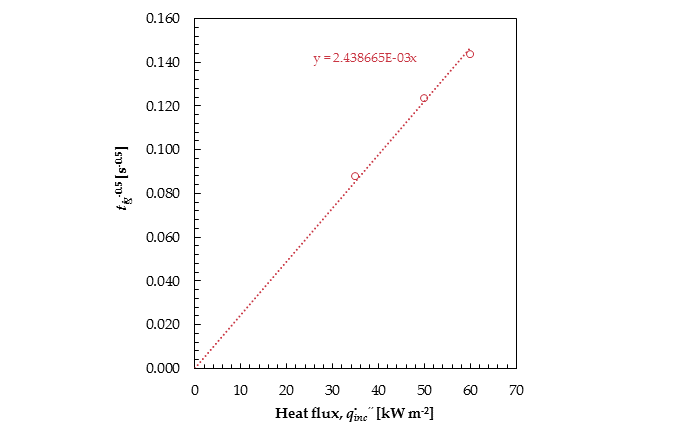
D. Ignition parameters
| Critical heat flux for ignition | Ignition temperature | Total heat transfer coefficient of losses | Apparent thermal inertia |
|---|---|---|---|
| q̇″cr [kW m−2] | Tig [°C] | hr [W m-2 K-1] | kρc [kW2 m-4 K-2 s] |
| 18.50 | 413 | 42.40 | 1.125 |
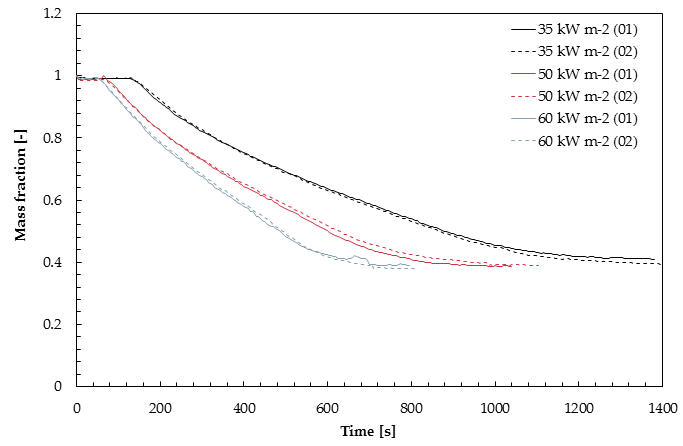
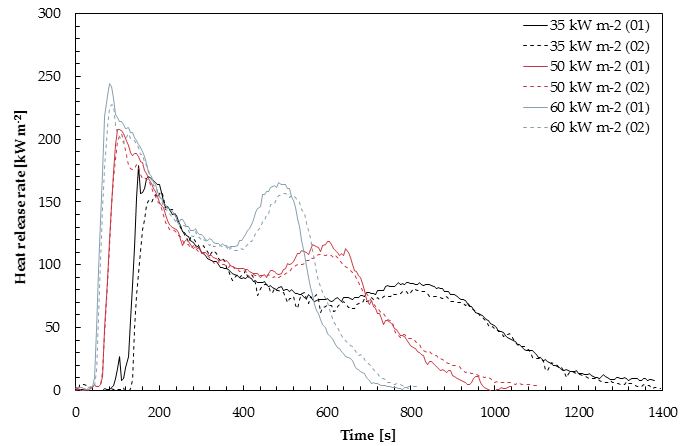
E. Burning behaviour
| Heat flux | Test | Time to ignition | Fraction of mass residue | Peak heat release rate | Total energy released |
|---|---|---|---|---|---|
| q̇″inc [kW m-2] | tig [s] | mres [-] | q̇″p [kW m-2] | Qt [MJ m-2] | 35 kW m-2 |
| Test 1 | 126 | 0.41 | 178.94 | 87.73 | |
| Test 2 | 134 | 0.39 | 158.38 | 81.81 | |
| Avg | 130 | 0.40 | 168.66 | 84.77 | 50 kW m-2 |
| Test 1 | 66 | 0.39 | 207.71 | 84.12 | |
| Test 2 | 65 | 0.39 | 204.51 | 83.43 | |
| Avg | 66 | 0.39 | 206.11 | 83.77 | 60 kW m-2 |
| Test 1 | 46 | 0.39 | 244.55 | 82.64 | |
| Test 2 | 51 | 0.38 | 227.71 | 82.82 | |
| Avg | 48 | 0.38 | 236.13 | 82.73 | 80 kW m-2 |
| Test 1 | - | - | - | - | |
| Test 2 | - | - | - | - | |
| Avg | - | - | - | - |
| Test | ΔHc [kJ g-1] |
|---|---|
| 35 kW m-2 (Test 1) | 38.47 |
| 35 kW m-2 (Test 2) | 34.97 |
| 50 kW m-2 (Test 1) | 35.39 |
| 50 kW m-2 (Test 2) | 35.36 |
| 60 kW m-2 (Test 1) | 35.26 |
| 60 kW m-2 (Test 2) | 34.67 |
| 80 kW m-2 (Test 1) | - |
| 80 kW m-2 (Test 2) | - |
| Average | 35.69 |
| Std dev | 1.39 |
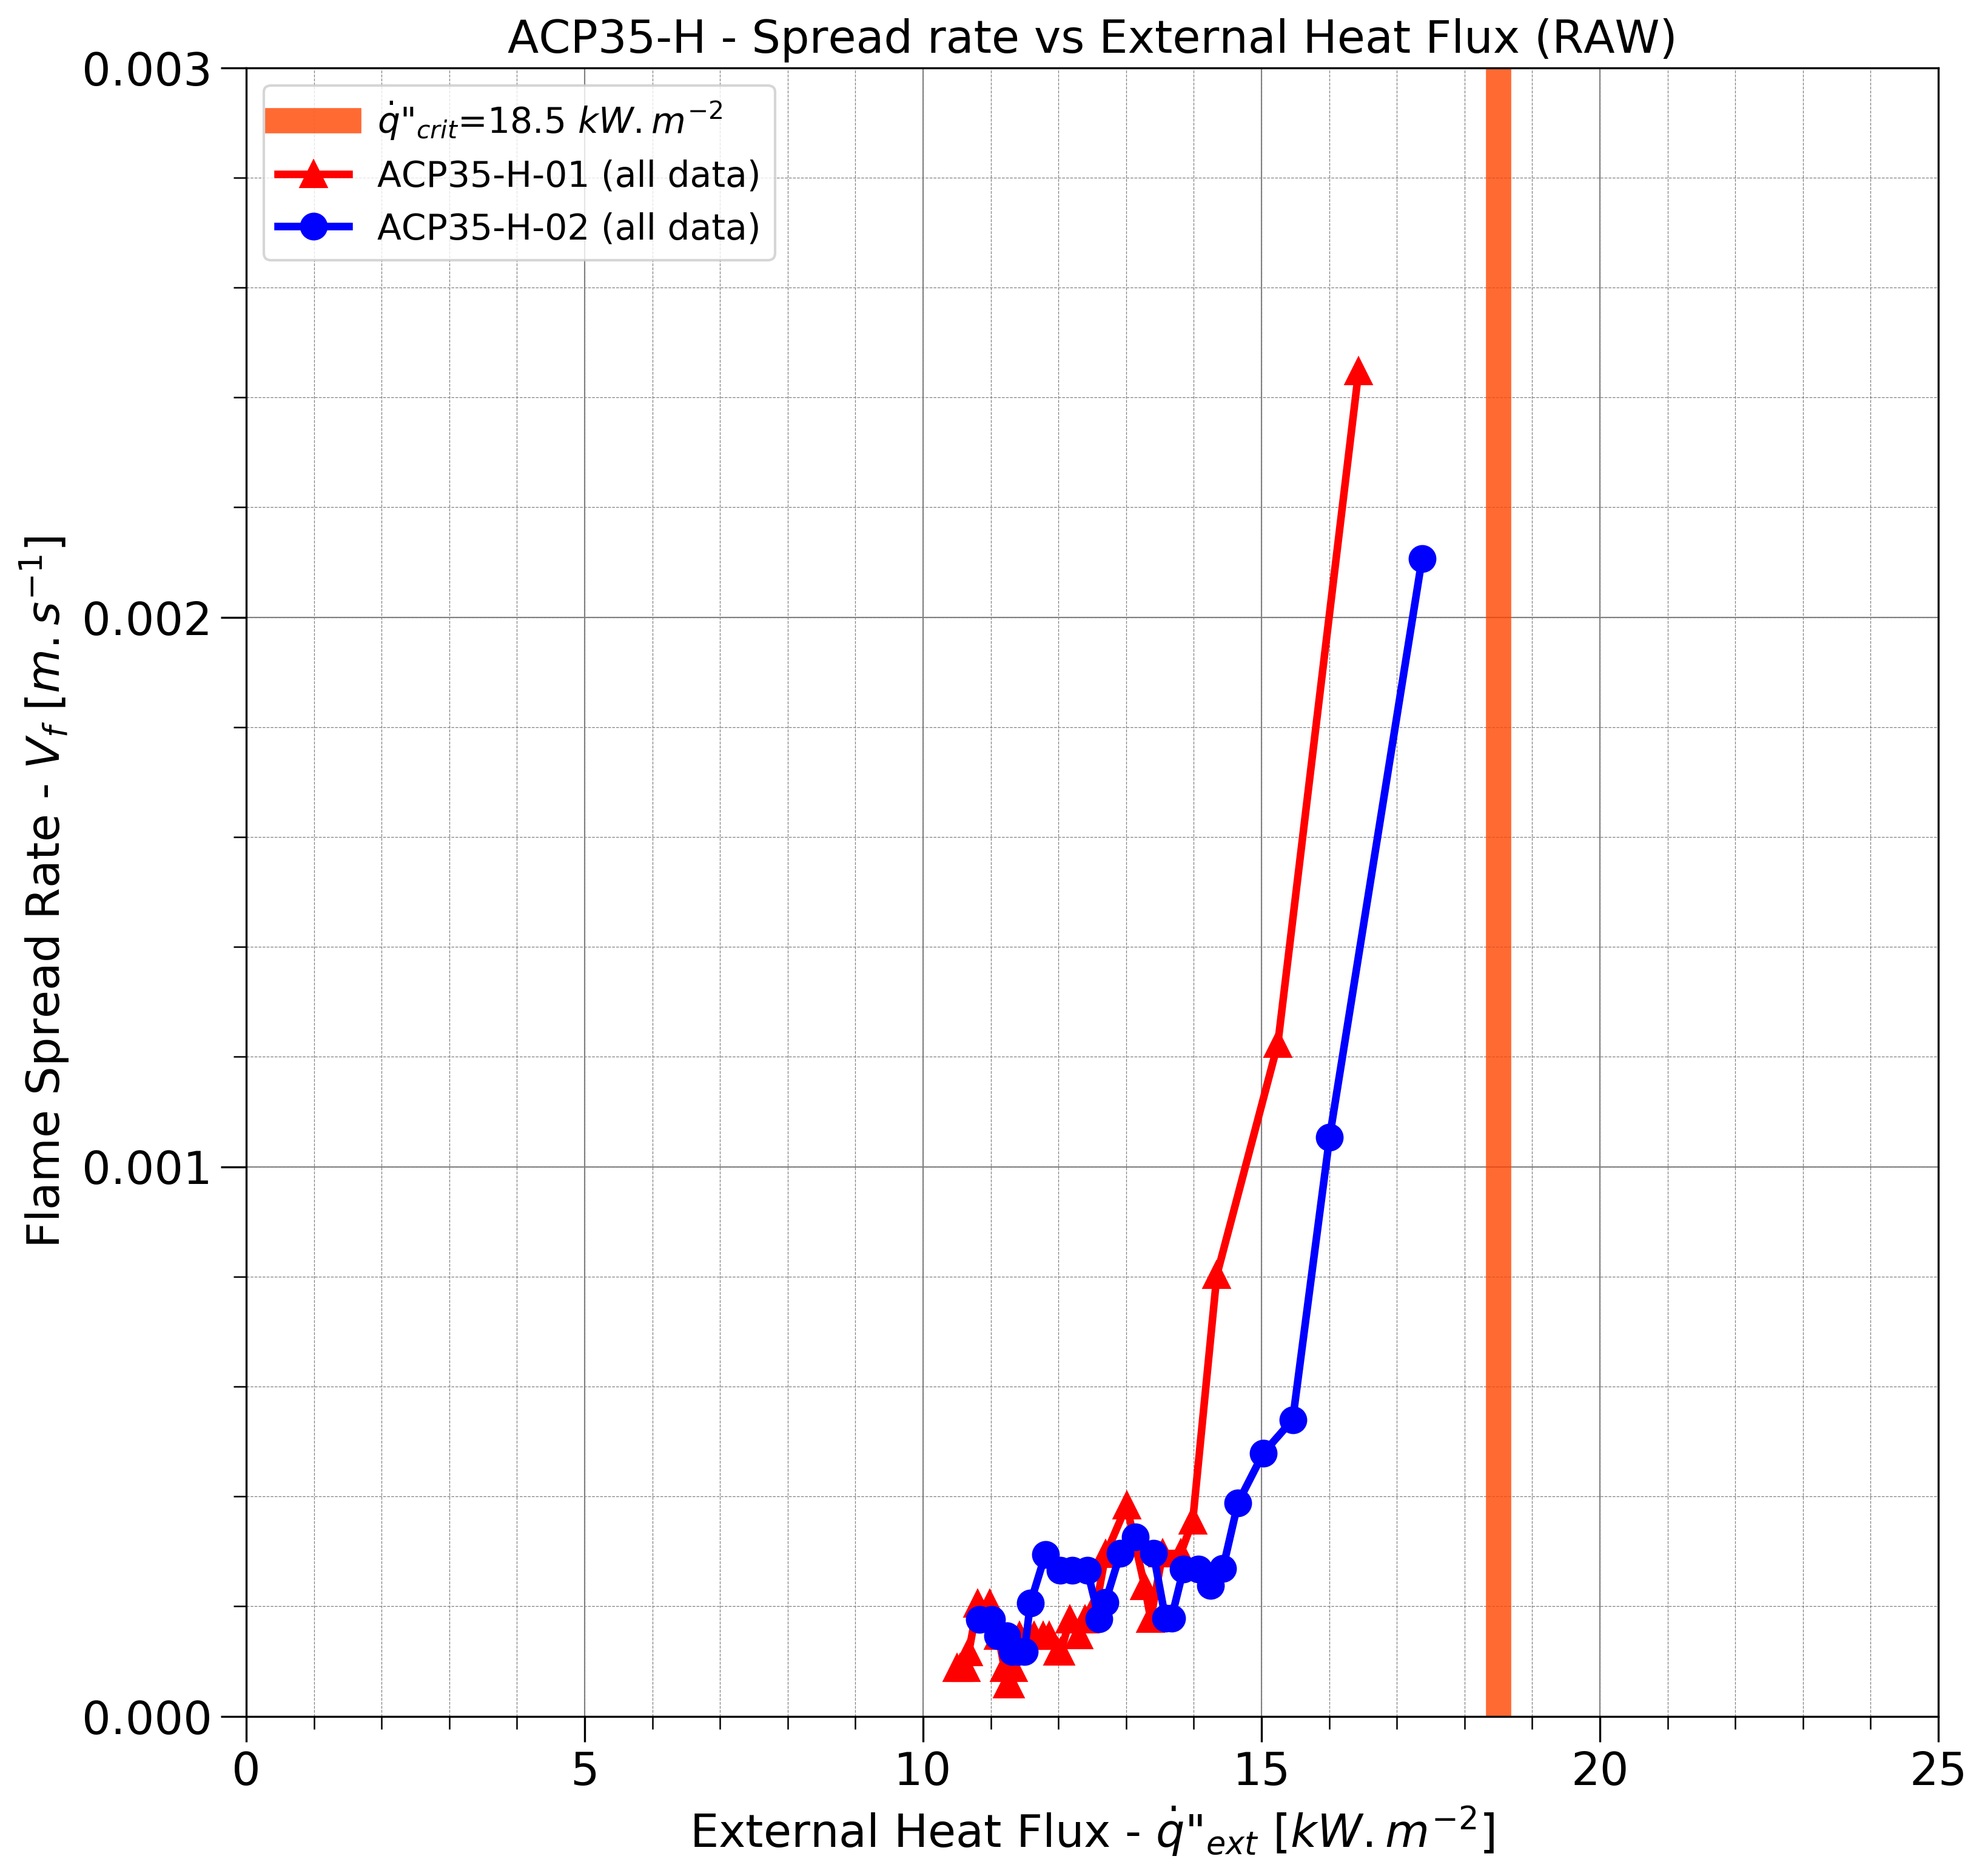
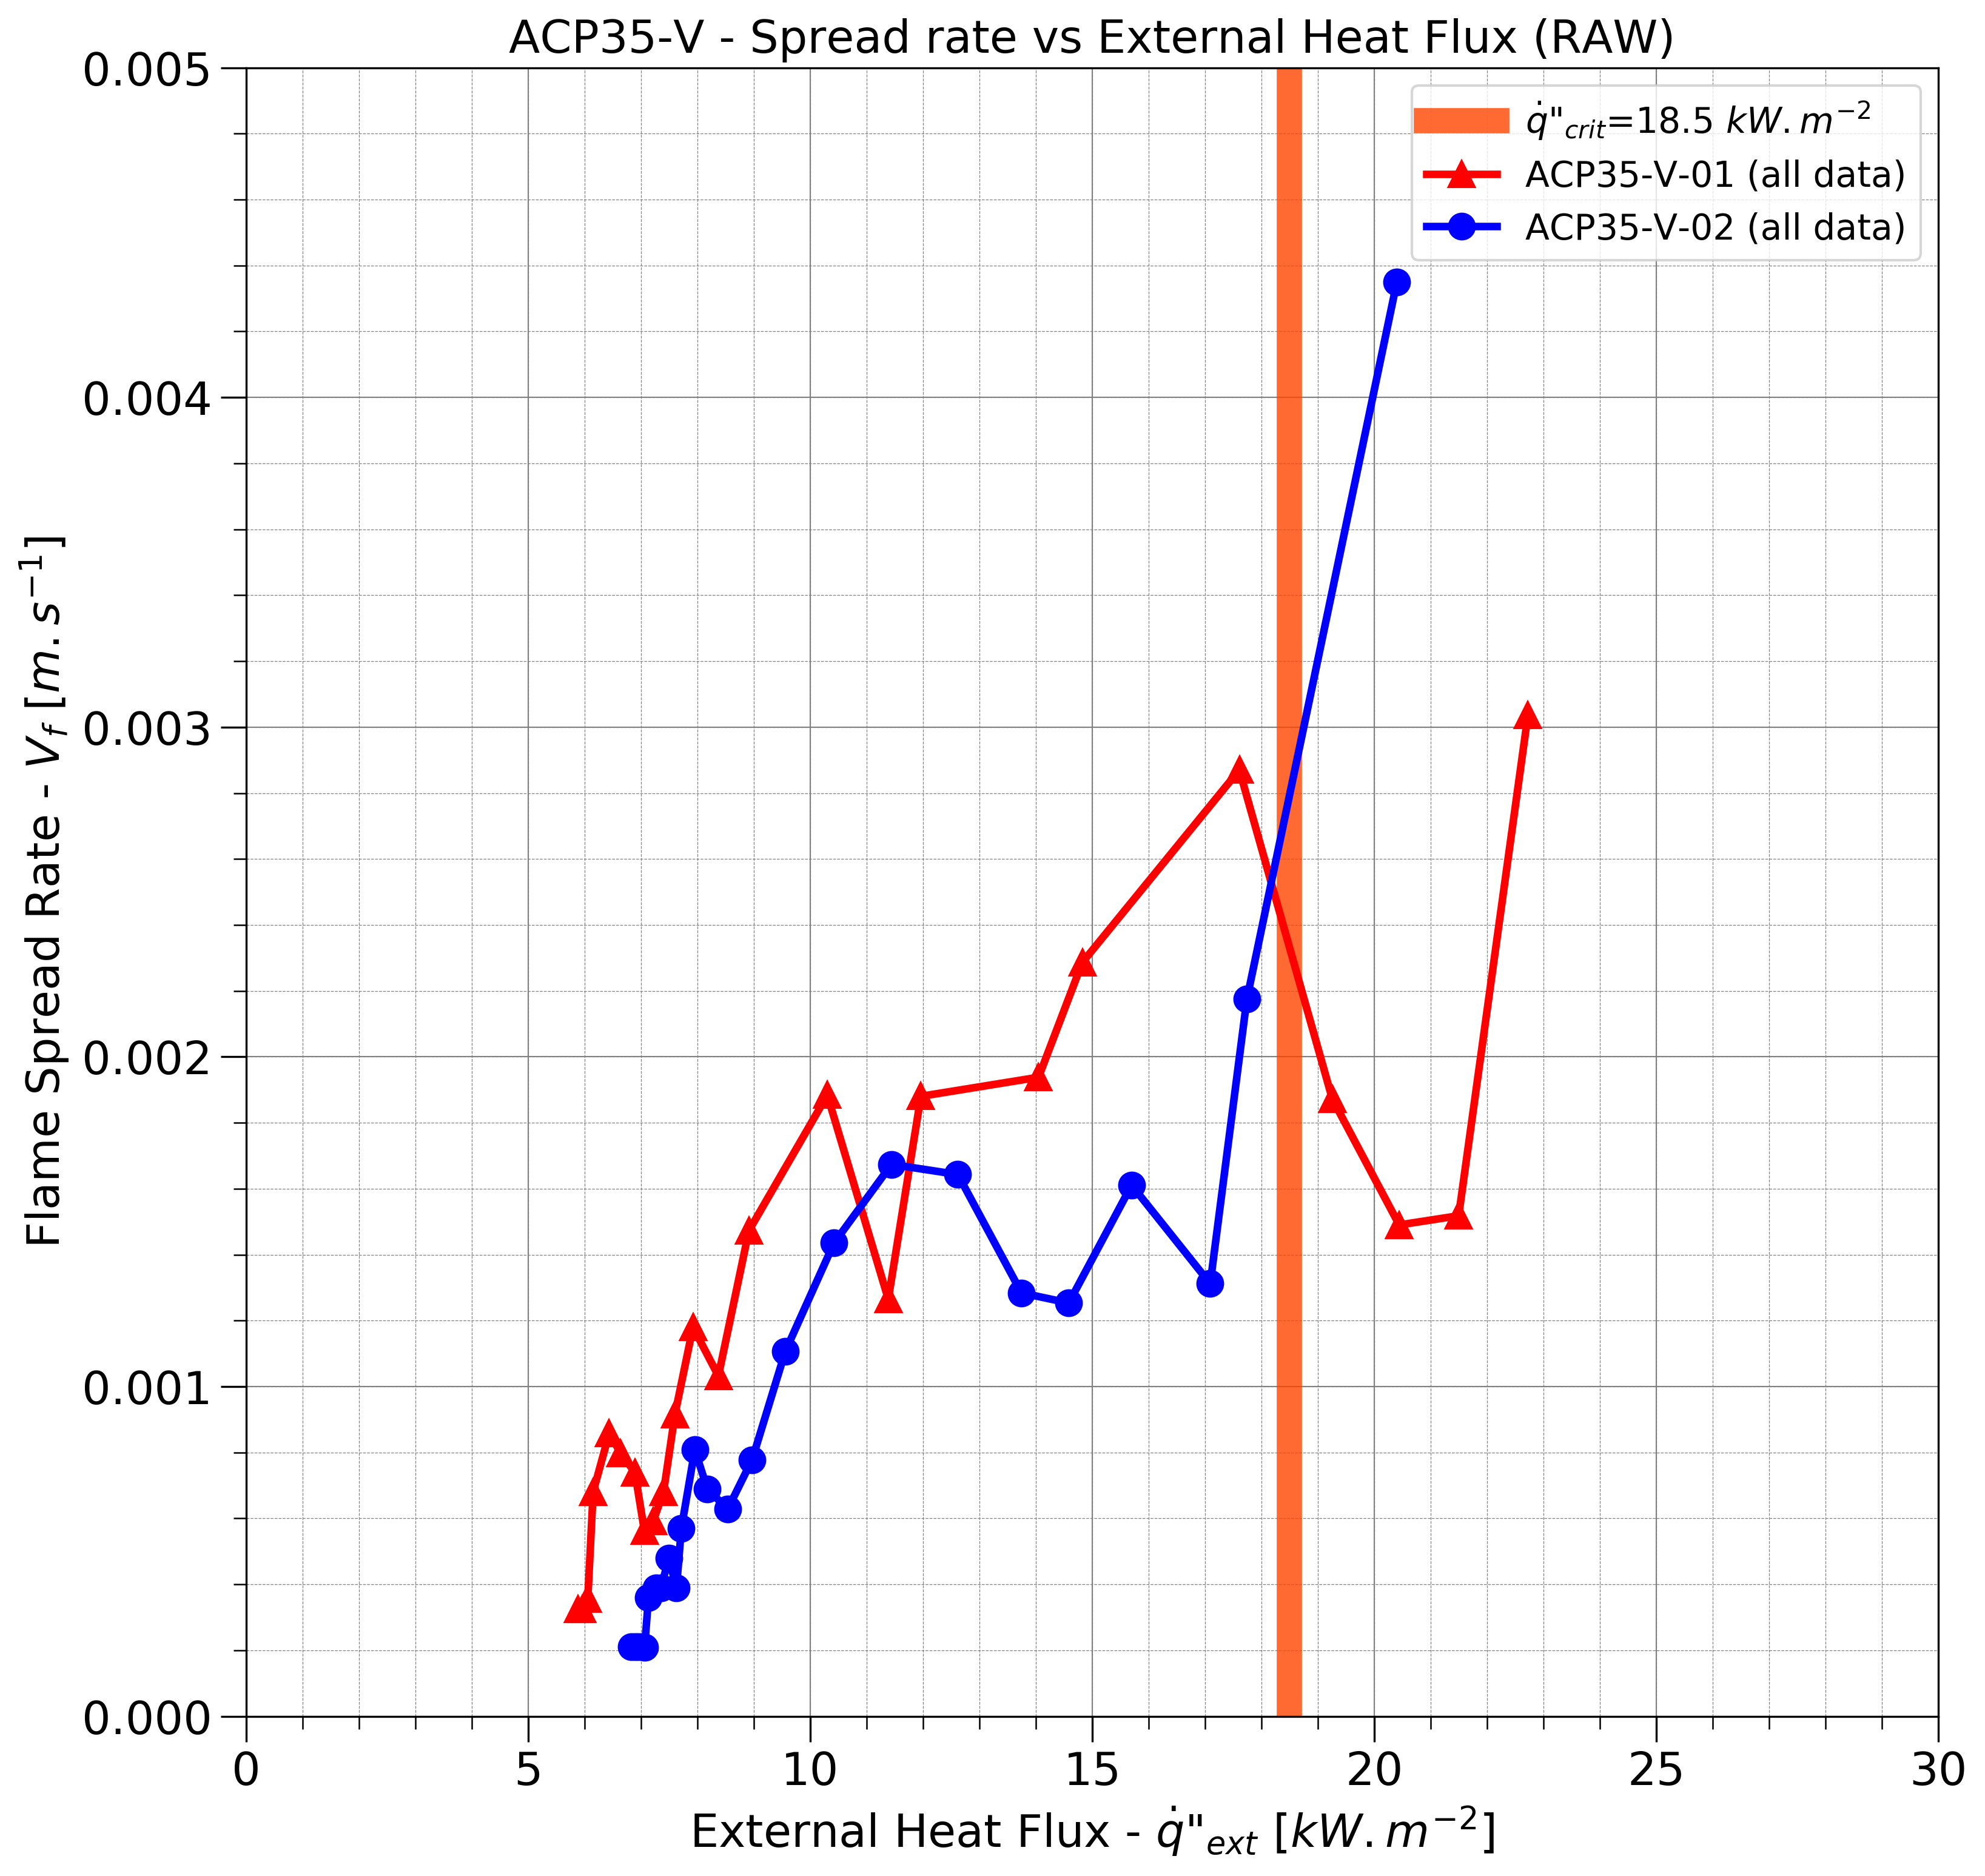
F. Flame Spread
| Orientation | q̇″min.spread [kW m-2] | Vf.min [mm s-1] |
|---|---|---|
| Horizontal | 10.60 | - |
| Vertical | 6.30 | - |
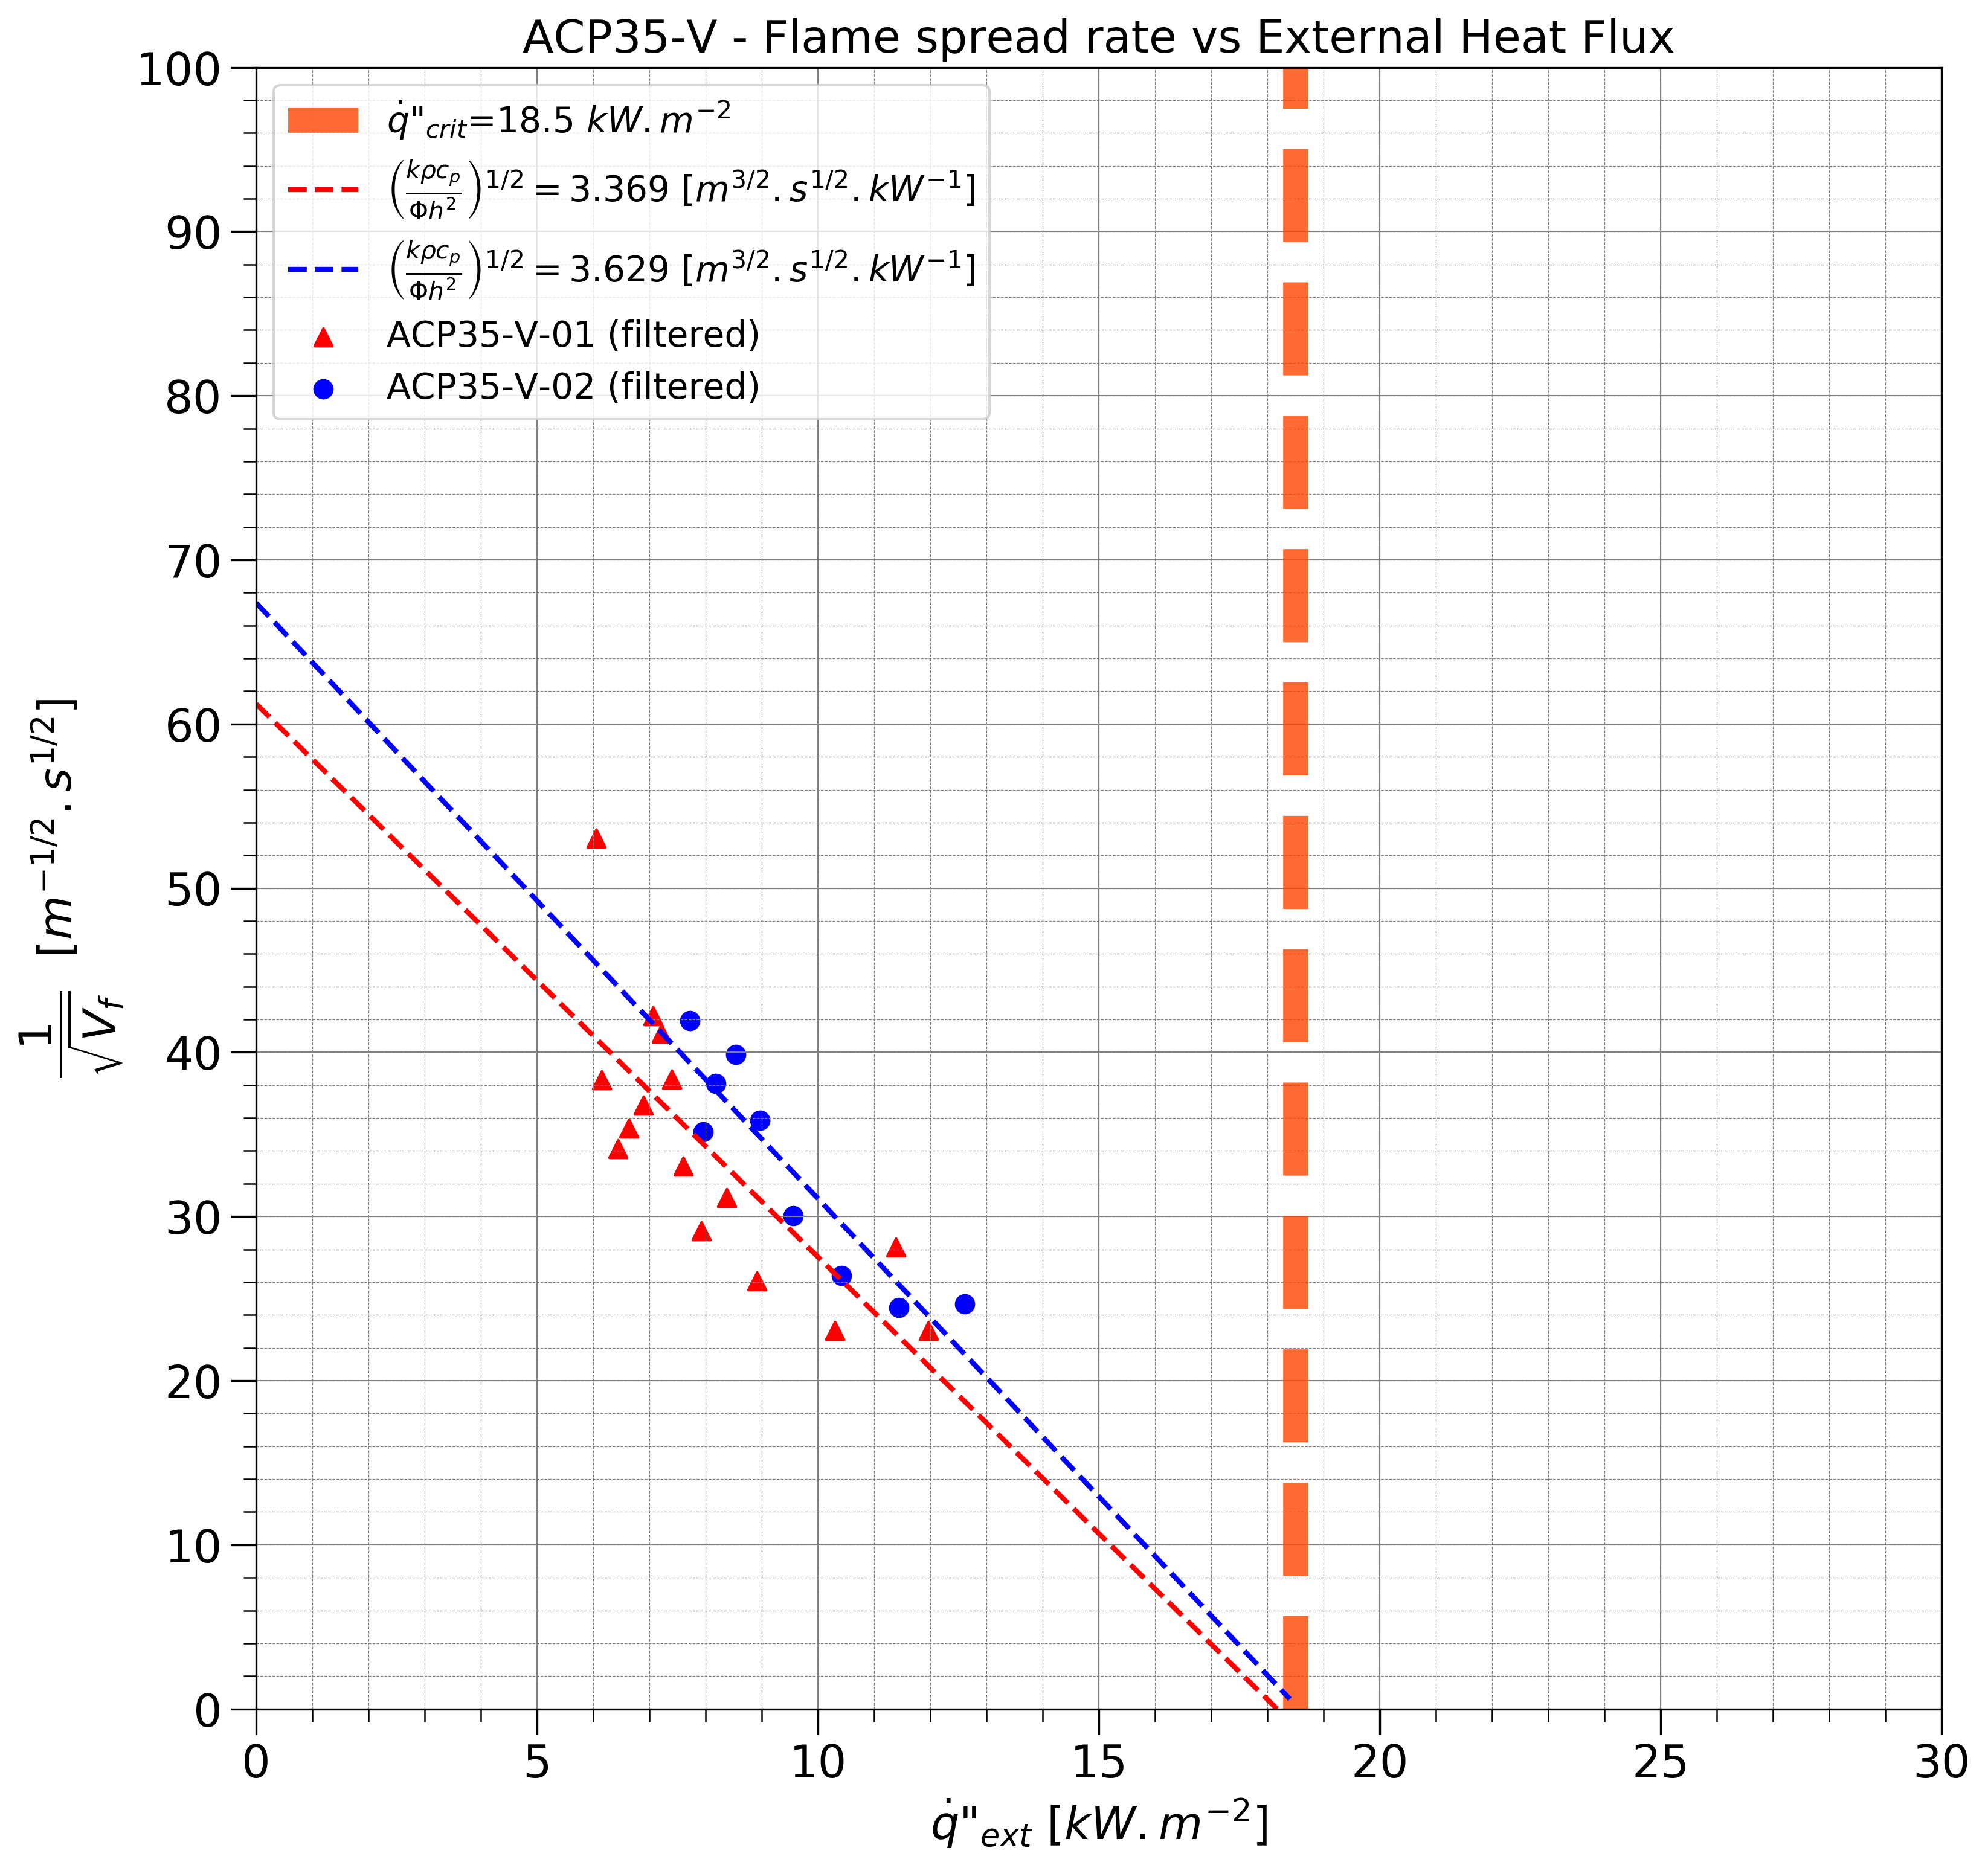
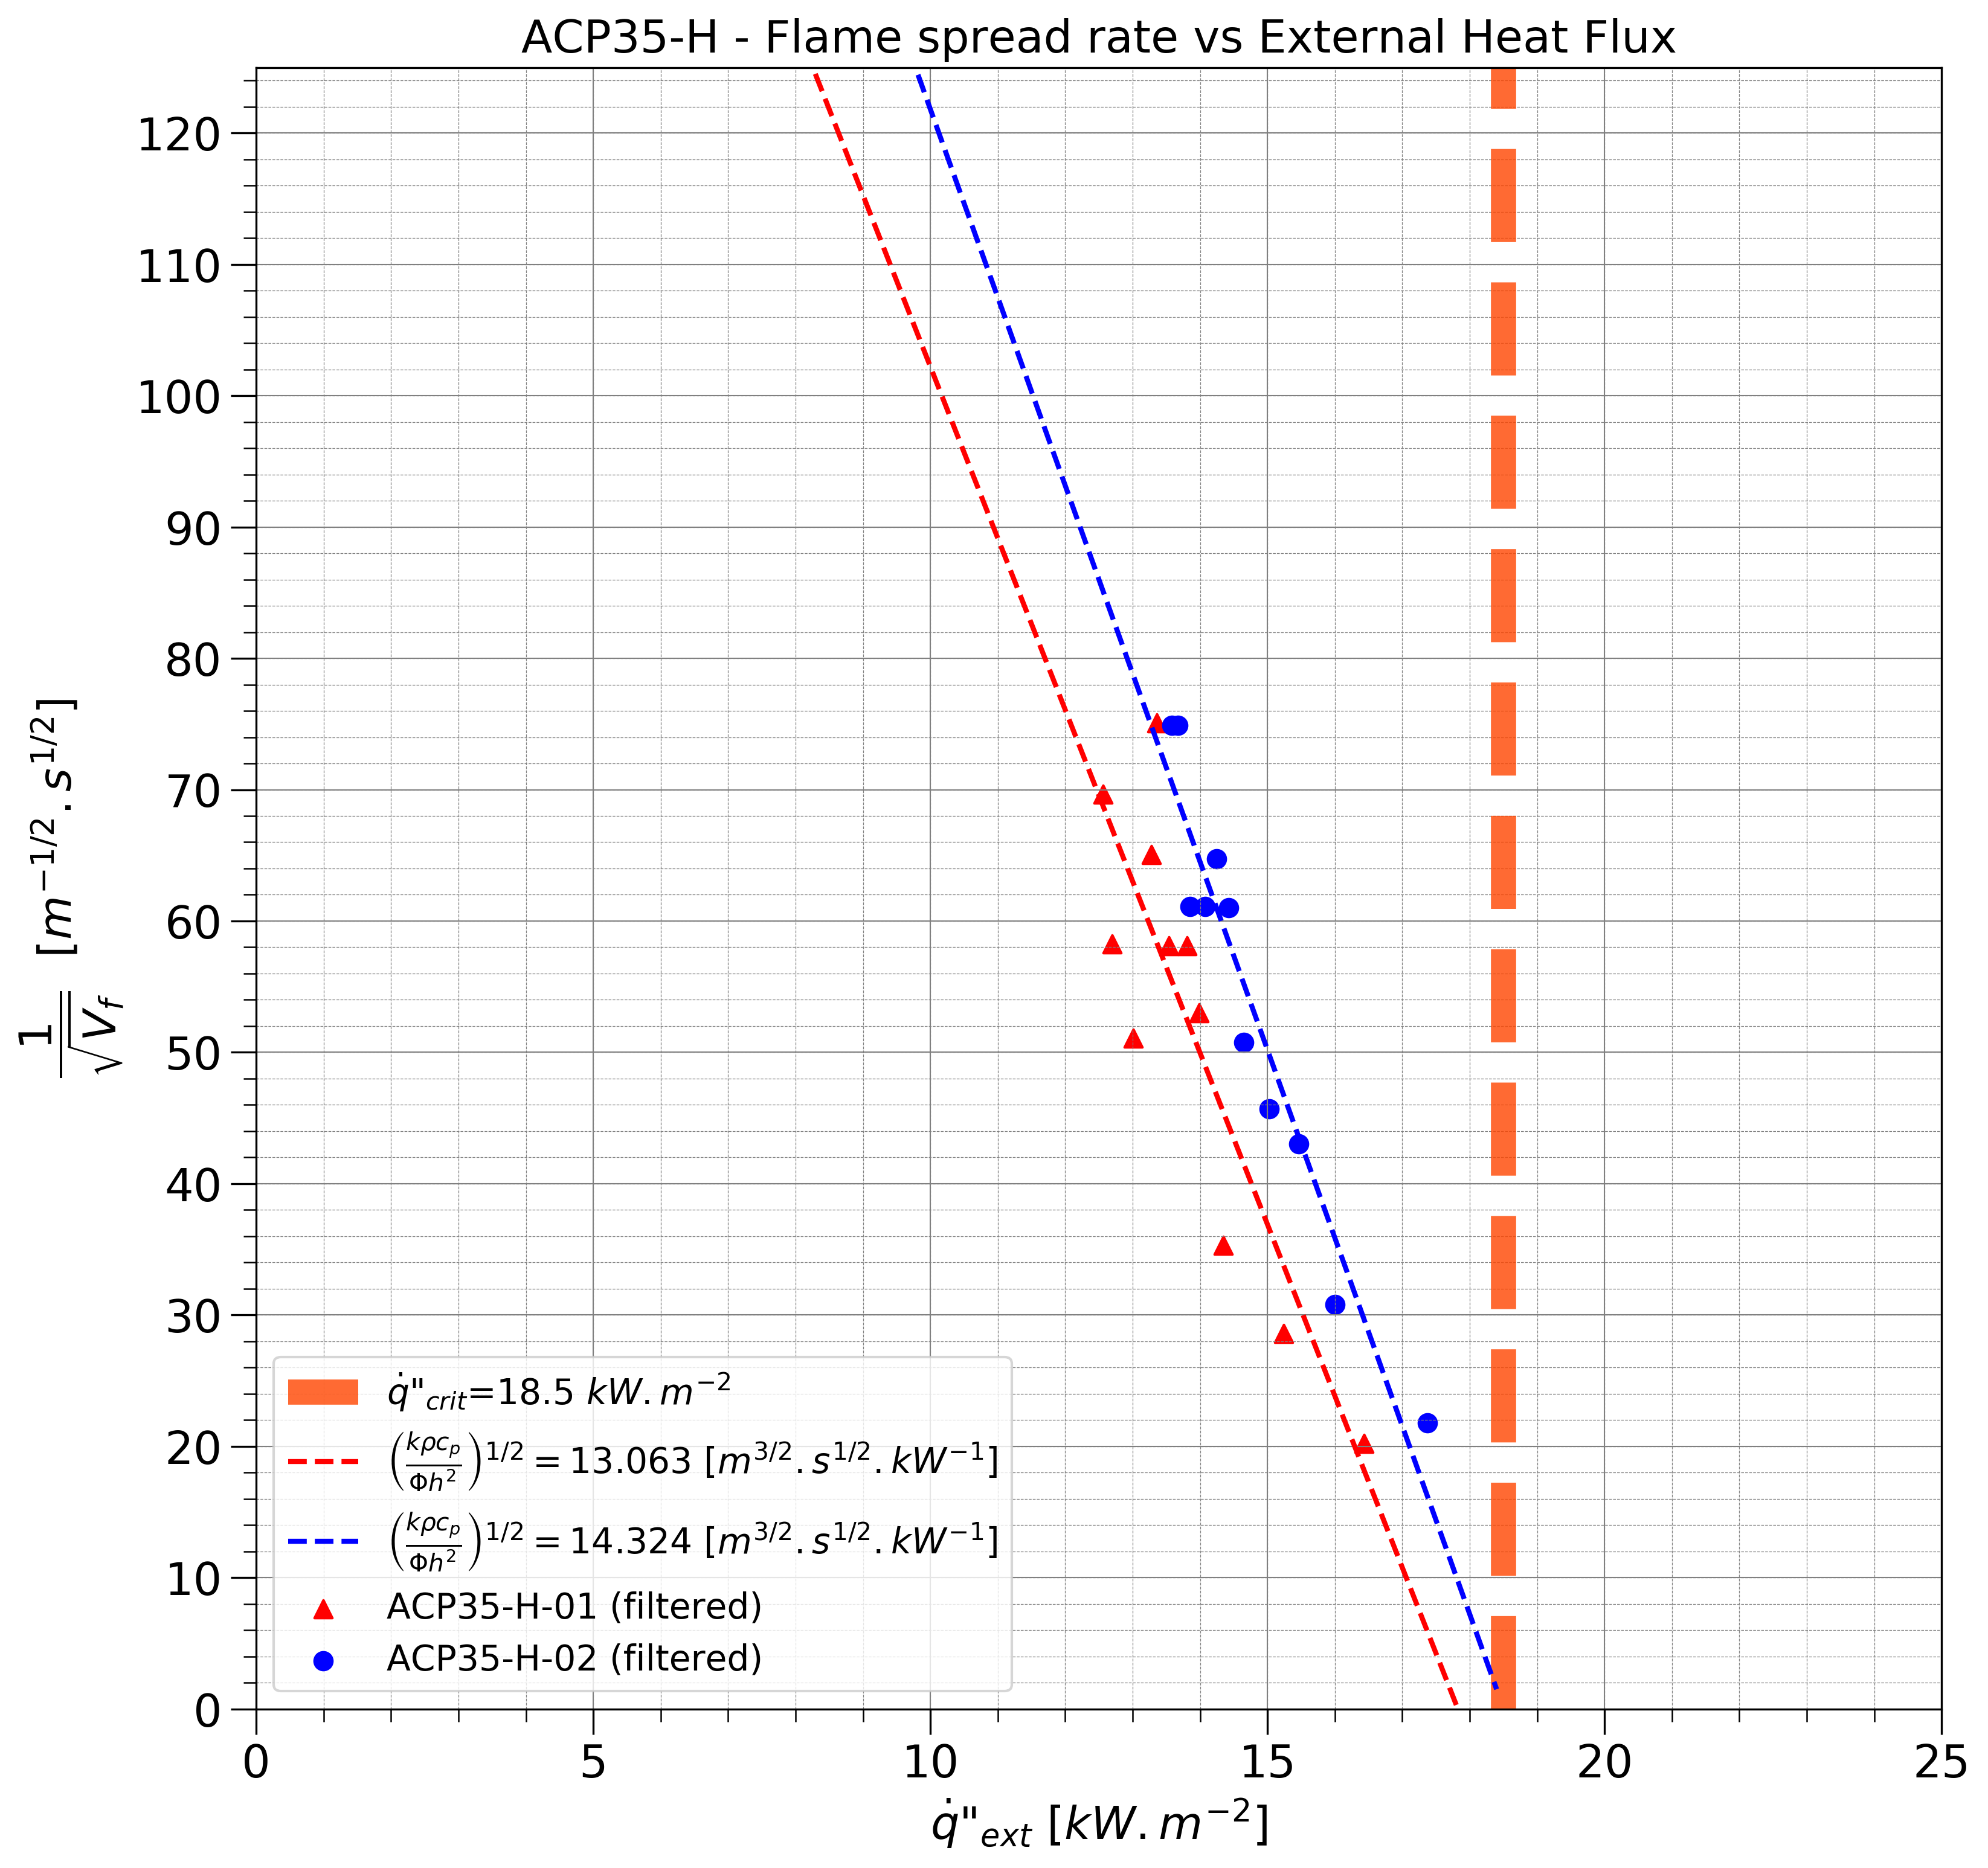
| Orientation | Trial | (kρcp⁄Φh2)1⁄2 [m3⁄2 s1⁄2 kW-1] | Φ [kW2 m-3] |
|---|---|---|---|
| Horizontal | 1 | 13.063 | 3.67 |
| Horizontal | 2 | 14.324 | 3.05 |
| Vertical | 1 | 3.369 | 55.12 |
| Vertical | 2 | 3.629 | 47.51 |